This project was developed to help address an urgent action identified under the updated Conservation Advice for the Maugean Skate to increase the levels of dissolved oxygen in Macquarie Harbour. Both computer modelling and field studies have demonstrated the role that salmonid aquaculture and river flows both play in influencing the dissolved oxygen status of the harbour (MHDOWG 2014; Ross & MacLeod 2017, Wild-Allen et al. 2020). A climate-driven increase in bottom water temperatures of 1.5-2oC over the past 30 years in the harbour is also considered to have influenced the observed decline in oxygen through decreased solubility and increased metabolic rates (Ross et al., 2021). Through this FRDC funded project, the salmonid aquaculture industry has committed to helping address this immediate priority to increase oxygen levels to support the conservation efforts for the skate and to help offset the oxygen drawdown of salmonid aquaculture in the harbour. The scientific evaluation program will assess the efficacy and environmental response to the oxygenation. This evaluation will be critical in assessing the feasibility and scalability of the system for either future offsetting and/or remediation of bottom water dissolved oxygen levels.
The information provided herein describes the background to the project, the approach and methods and a summary of progress. It is important to acknowledge that this document is a progress summary of the key findings to date and is not an exhaustive and detailed presentation of all available results. Full analyses and presentation of results will be undertaken in the final project report.
Macquarie Harbour on Tasmania’s west coast has been a site for salmonid aquaculture since the 1980s, however it wasn’t until the early 2000s that standing biomass in the harbour increased beyond 1000 tonnes. Across the following decade biomass increased, peaking at just over 20,000 tonnes in 2014/15 before further increases were halted due to progressive signs of environmental stress in the Harbour. In late 2013 a decline in oxygen levels in the bottom waters of the Harbour was confirmed (MHDOWG 2014), and in spring 2016 a major deterioration in sediment conditions was observed (Ross et al., 2017). To reduce the pressure on the harbour and allow for environmental recovery, the maximum permissible biomass has progressively been lowered by the EPA since early 2017 (see the EPA website HERE for more details).
Across this period there has been a major focus on understanding the population status and ecology of the endangered Maugean skate (Zearaja maugeana) and the potential interaction with salmonid aquaculture (Bell et al. 2016; Moreno et al. 2020). Moreno et al. (2020) documented two skate mortality events and the complex relationship with environmental conditions in Macquarie Harbour and oxygen depleted waters. The most recent research by Moreno & Semmens (2023) reports an estimated decline in relative abundance of the skate by up to 47% in Macquarie Harbour between 2014 and 2021. There is now substantial concern for the species, and this has prioritised the skate for threatened species listing reassessment under the Environment Protection and Biodiversity Conservation Act 1999 (EPBC Act) and the updating of the current Conservation Advice for the species (DCCEEW 2023). In July 2023, the National Recovery Team for the Maugean skate was formed to develop and coordinate the implementation of a conservation plan or program. Membership of the Recovery Team includes representation from all stakeholder groups with an interest in Maugean skate conservation management, including Australian, State, and local governments, Hydro Tasmania, aquaculture industry, local community, research organisations, natural resource managers, and environmental non-government organisations.
The updated Conservation Advice for the skate identified several key urgent actions for implementation prior to summer 2023, including ‘Increasing the levels of dissolved oxygen in Macquarie Harbour, via a reduction in aquaculture organic loads and/or utilisation of mechanical/engineering environmental remediation technologies’. The Recovery Team convened an Environmental Remediation Feasibility Working Group to assess possible immediate and longer-term options to improve dissolved oxygen levels in Macquarie Harbour. Workshops were held on 31st August and 4th September and considered four remediation options: 1. removal or reduction of salmon biomass, 2. increase mixing of the water column, 3. increase exchange with the ocean (e.g. pipeline or dredging of the harbour entrance), 4. oxygenation of bottom waters via a pump (NRE Tas 2024). In summary, for option 1 it was considered that destocking salmon would not likely solve the issues in the short term (6 - 12 months) given the likely lag effect in any oxygen response. Option 2 was not considered viable in the short term given uncertainty and risks in relation to the stabilisation of the water column. Option 3 was not considered viable based on enormous costs, practical challenges and associated environmental risks. Option 4, whereby oxygenated water (typically super-saturated) is pumped to depth was considered the most viable option for further consideration given the approach and technology has previously been used successfully overseas and in Australia for environmental remediation (see Larsen et al. 2019; Liu et al. 2020; Stigebrandt & Anderson 2022, US Army Corps 2021). It was agreed to conduct a pilot study to assess the feasibility of this option and to address the various concerns that were identified. It was also agreed that a pilot study should be initiated prior to summer if possible.
Several subsequent meetings between scientists and the aquaculture industry led to the development of the pilot oxygen trial and associated research described here. The project concept, design and plan were also presented to government agencies and to the National Recovery Team for the Maugean skate. The end users and beneficiaries of this research and its potential application at scale are wide-ranging. The application at scale has the potential to make a significant contribution to the improvement of oxygen levels in the harbour and the conservation of the skate. At an industry level, the ability to help offset the oxygen drawdown due to salmon aquaculture will greatly benefit the sustainability of aquaculture operations in Macquarie Harbour. This will then extend to the associated economic and social benefits for local communities. Further innovation in the methodology and implementation of oxygenation have a wide range of other applications for environmental enhancement and remediation.
The project centres around three packages of work:
Importantly, the pilot trial will be run in a staged approach whereby the volume, duration and method of oxygen injection will be progressively scaled based on the model predictions and detailed water quality and ecosystem observations to ensure that the oxygen is delivered and retained in the bottom waters with no or minimal adverse ecological effects.
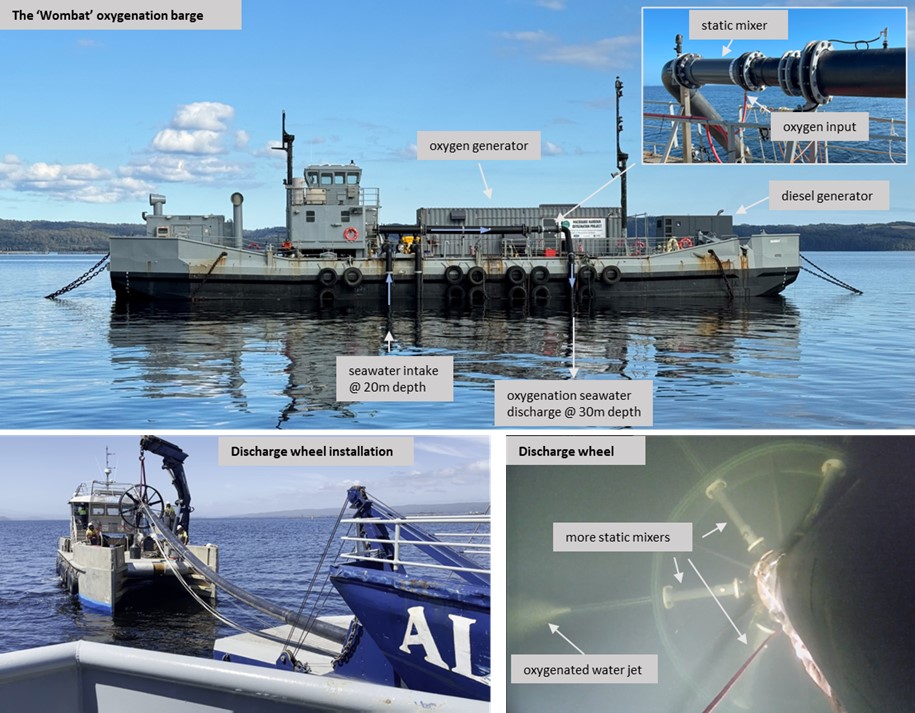
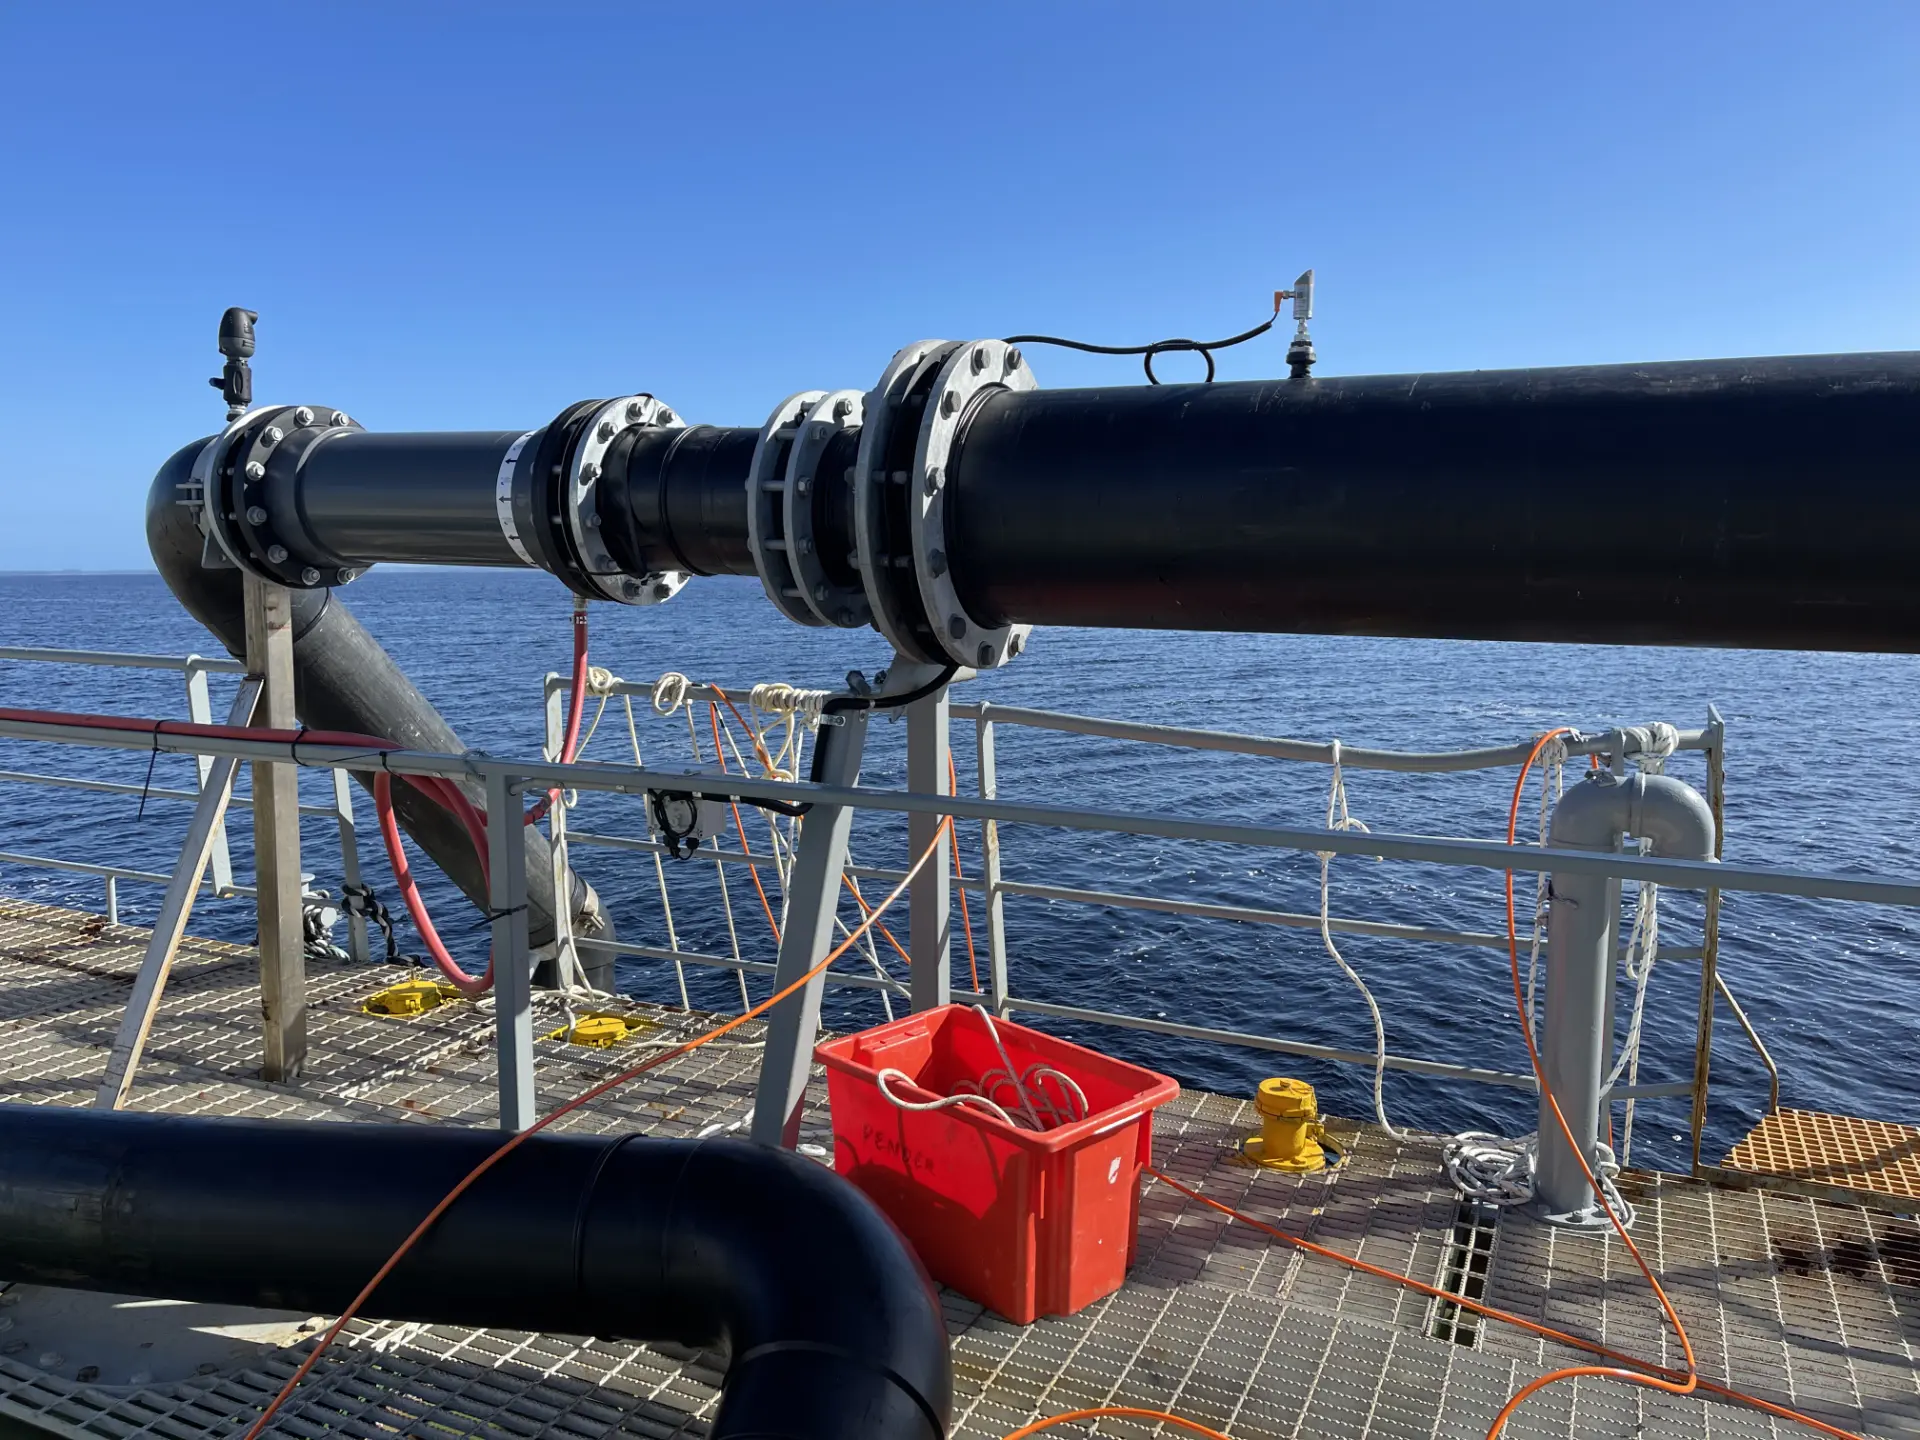
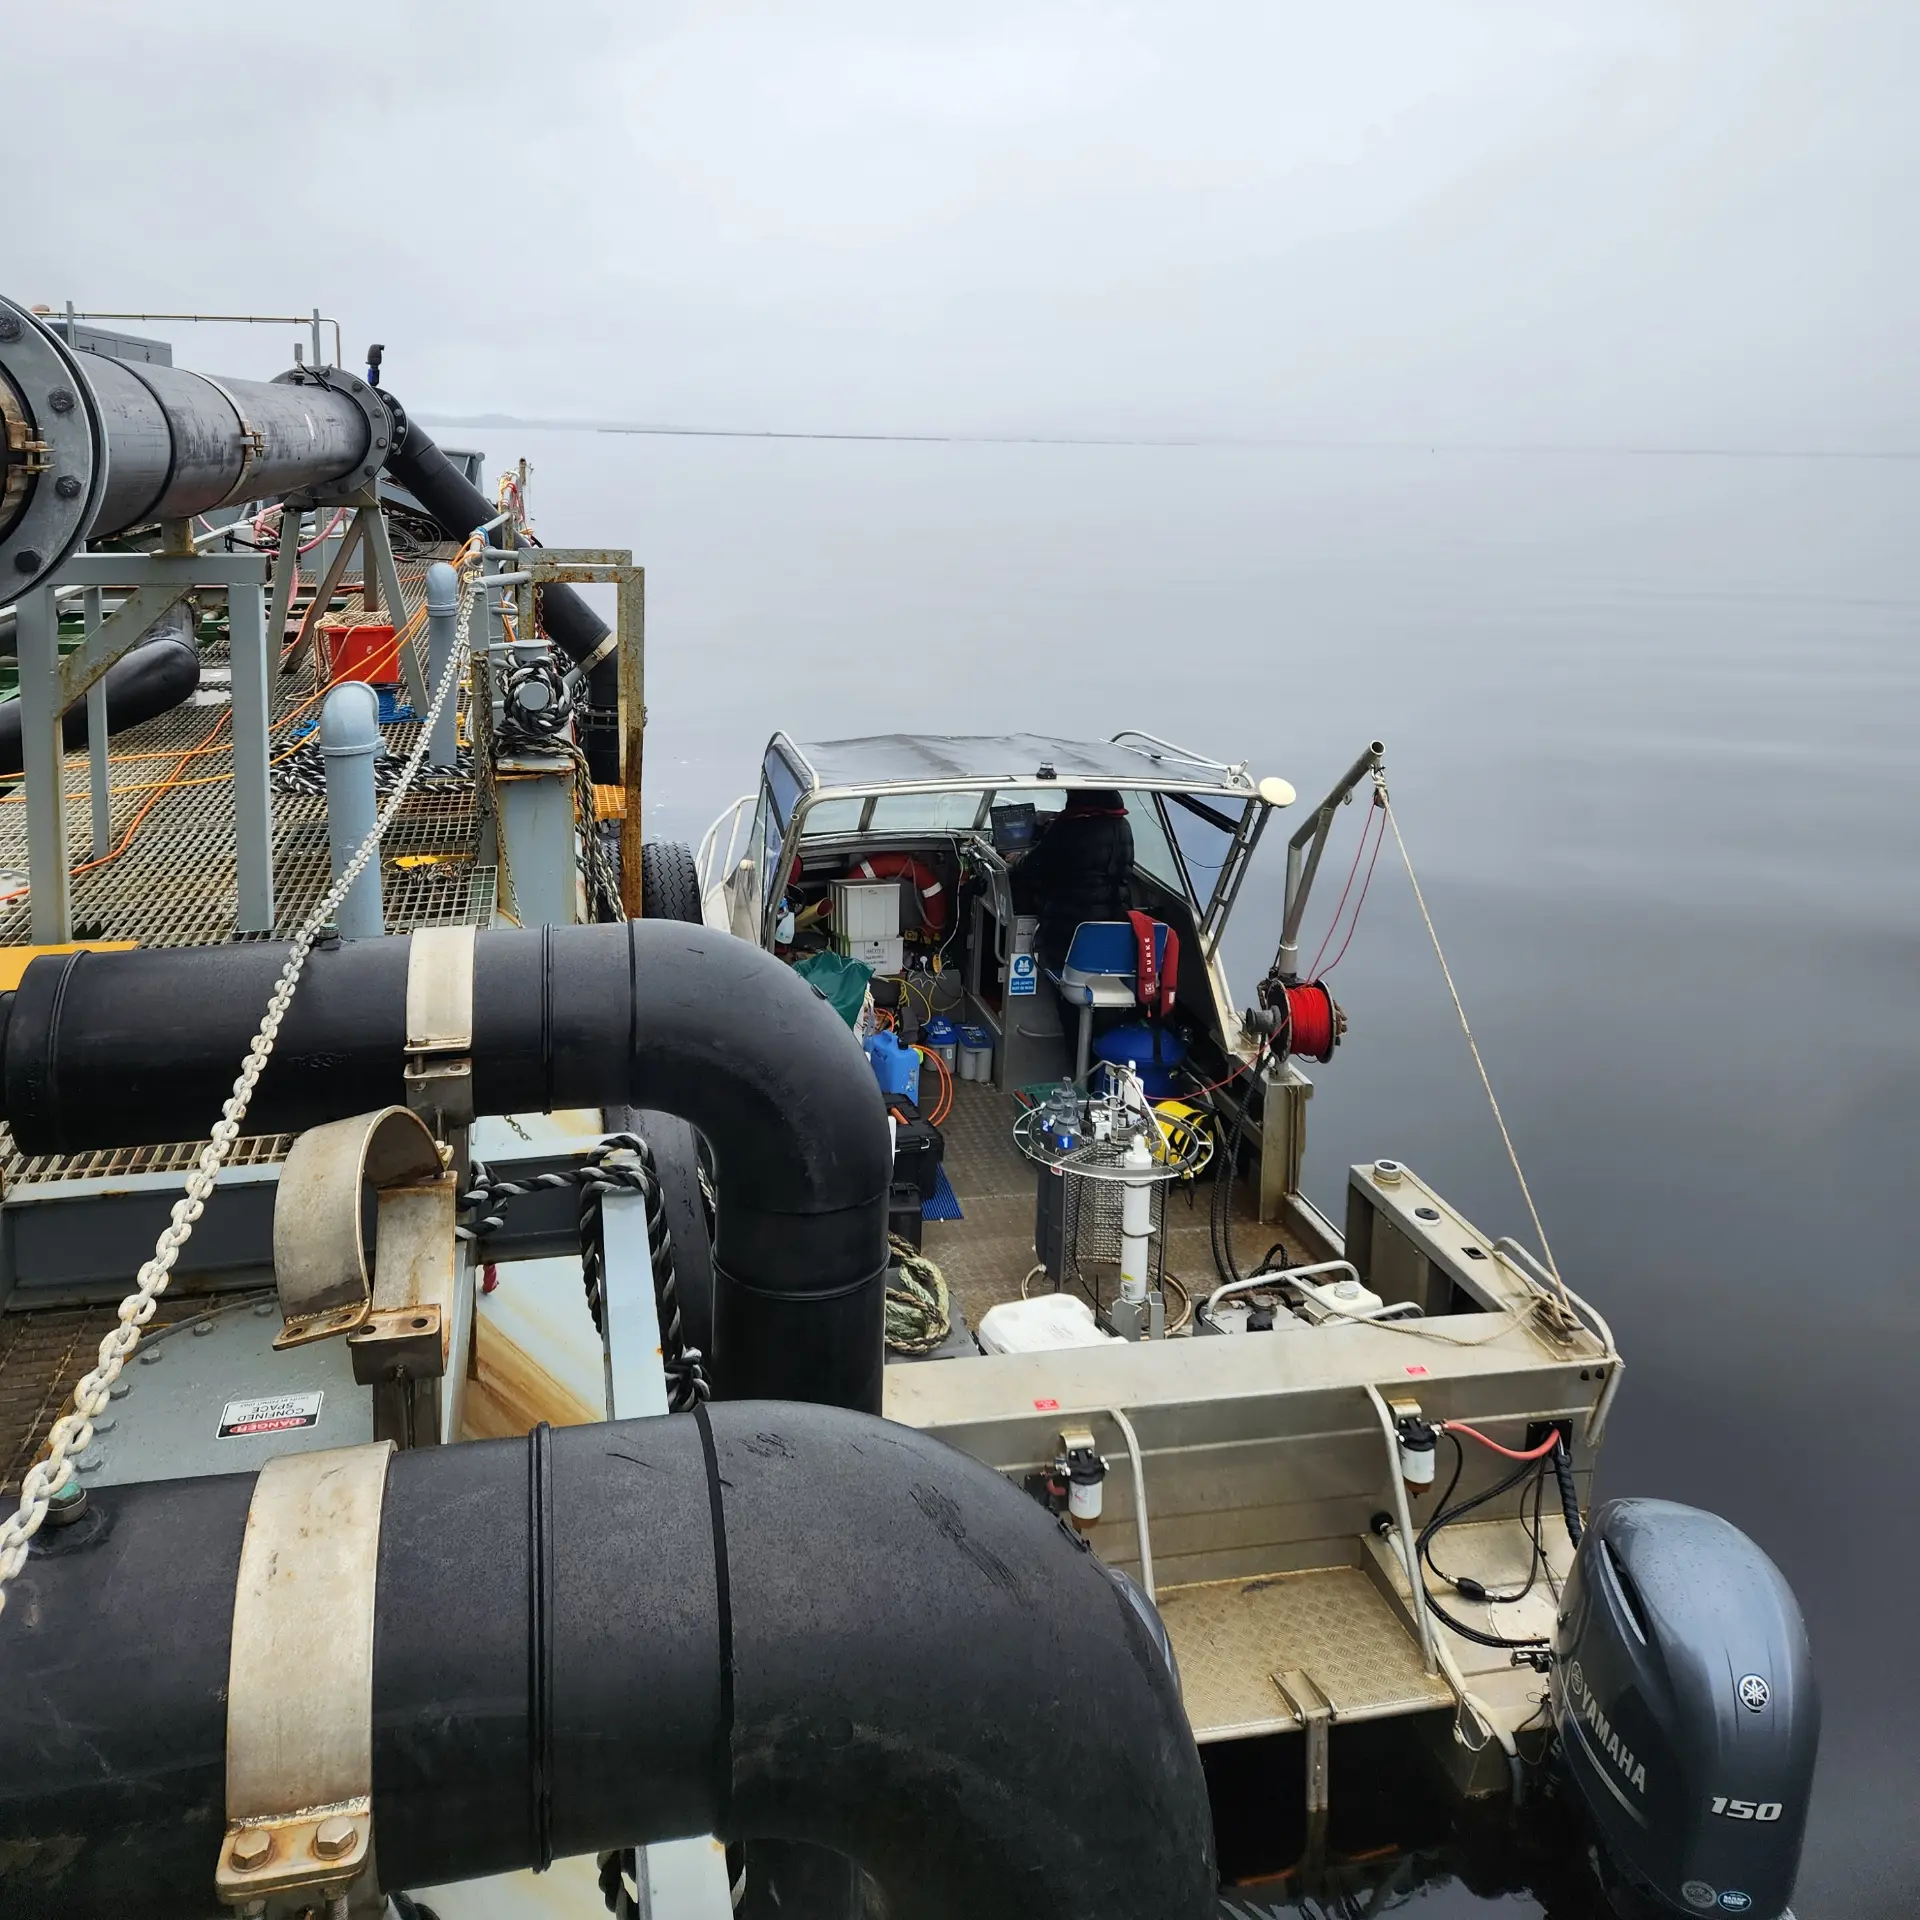
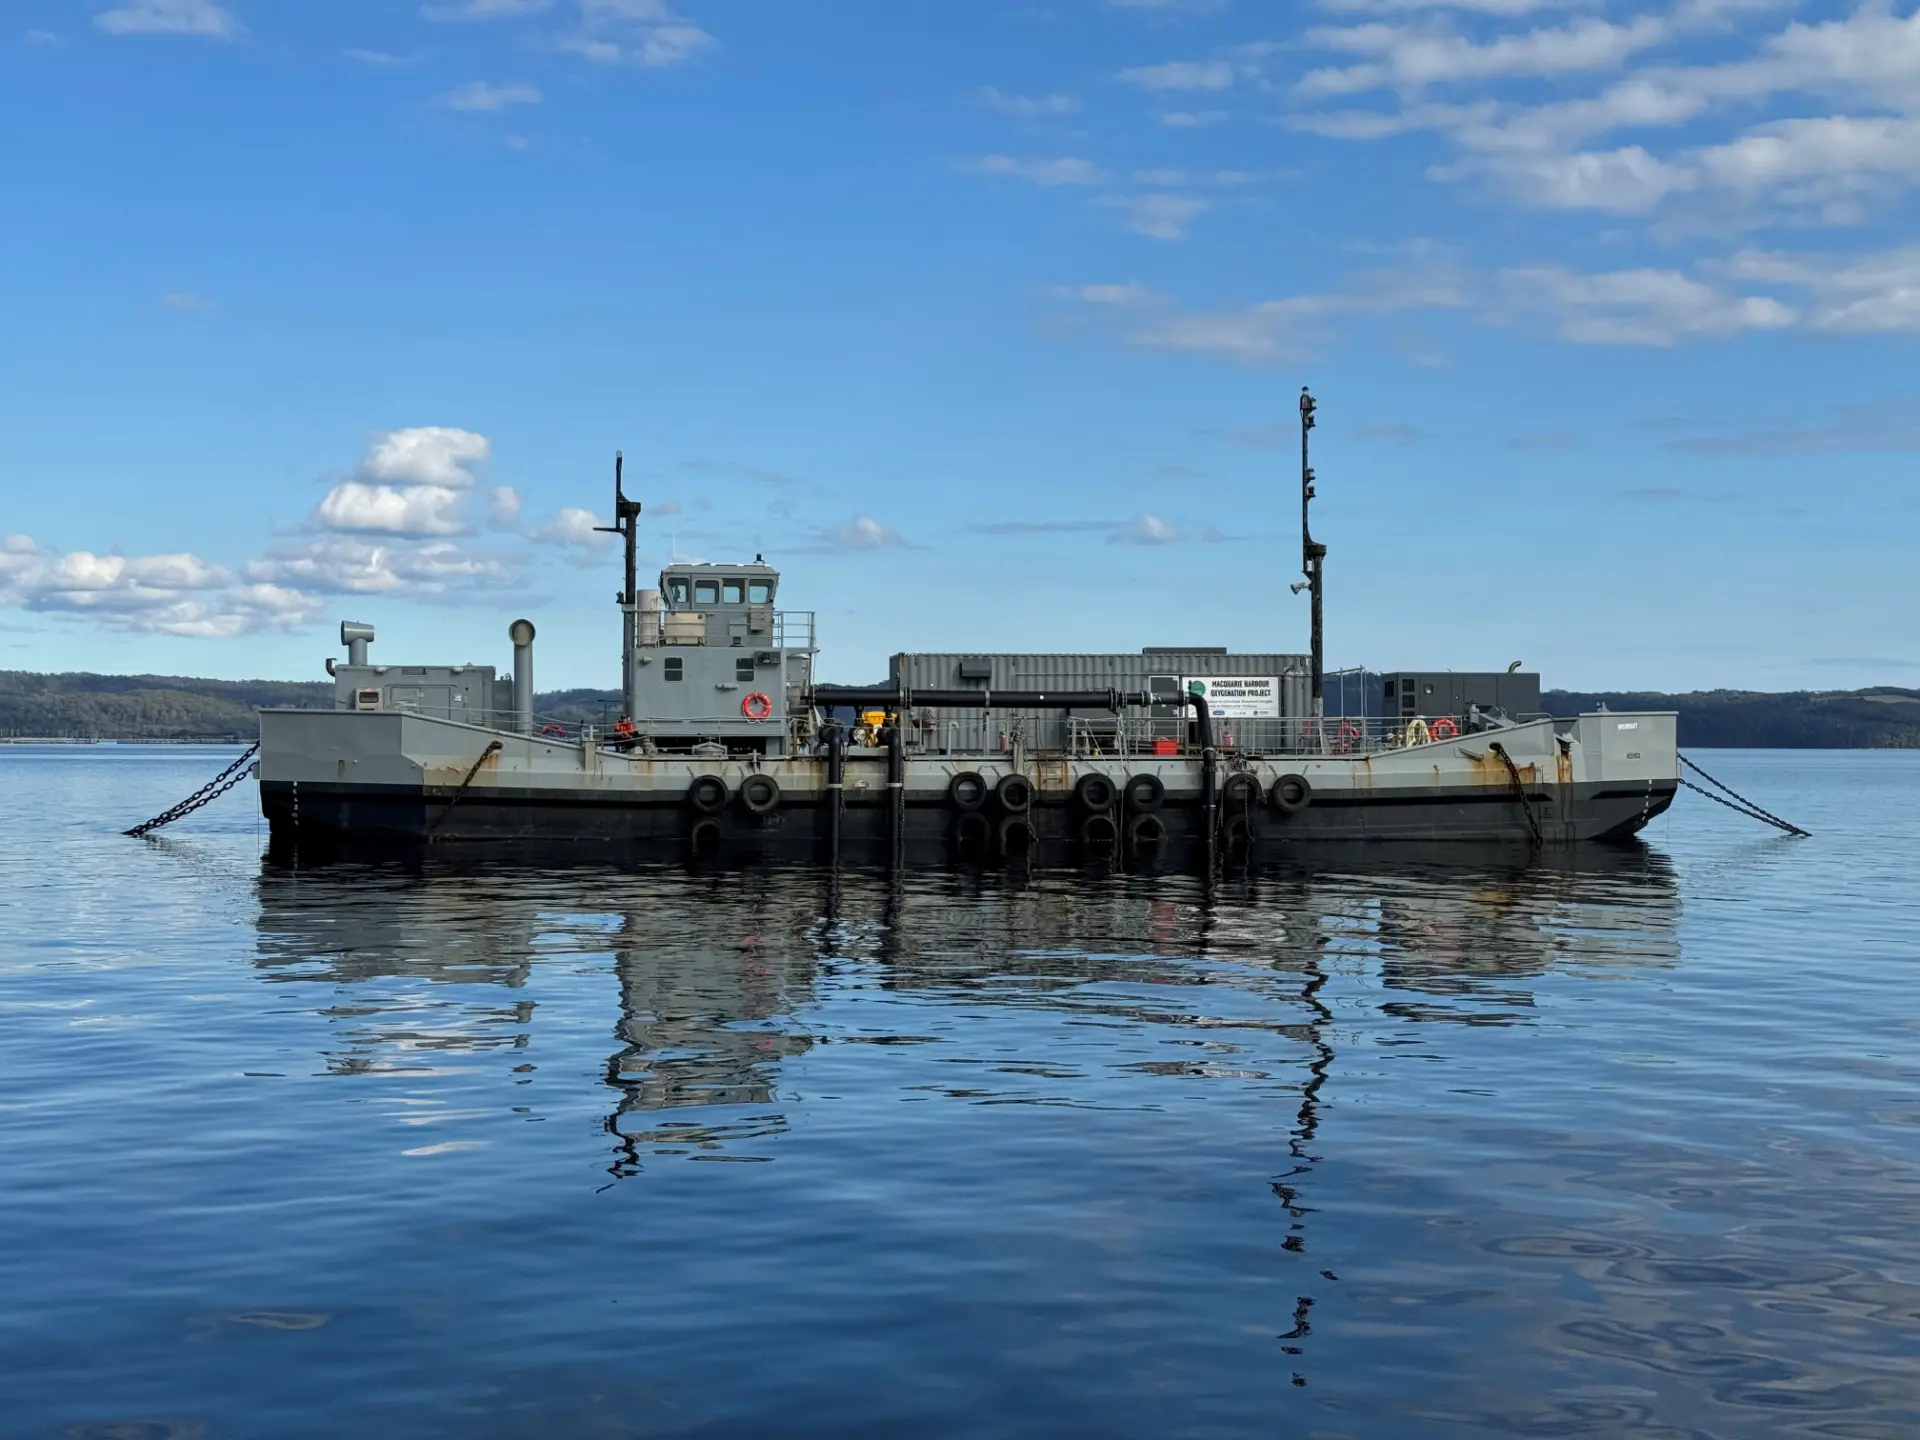
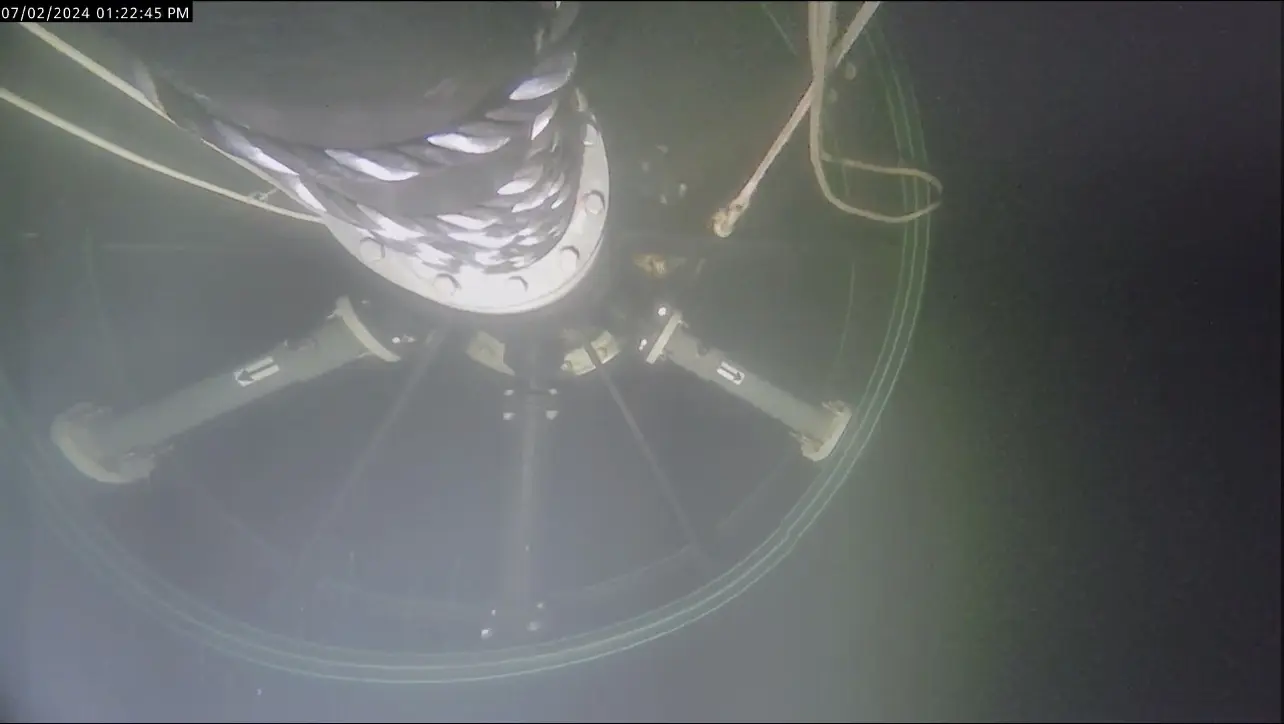
The ex-Navy bunker barge named ‘Wombat’, operated by Salmon Tasmania, is fitted with a large oxygen generator and seawater pumps (Figure 1). The oxygen generator, housed within a weatherproof shipping container, can generate up to 4840 kg/day of oxygen. Water is pumped from a depth of 20 m up to the barge, where it is injected with pressurised high purity oxygen gas that is broken up into very small bubbles (micro and nano bubbles) via a series of mixers. The water then travels down the outlet pipe to the discharge wheel at a depth of 30-40 m where the elevated pressure helps to dissolve the bubbles into solution. The highly oxygenated water is then injected into the receiving harbour waters through six radially positioned mixers designed to assist with the rapid dissolution of oxygen and to prevent larger bubbles of oxygen forming and rising to the surface and being lost to the atmosphere.
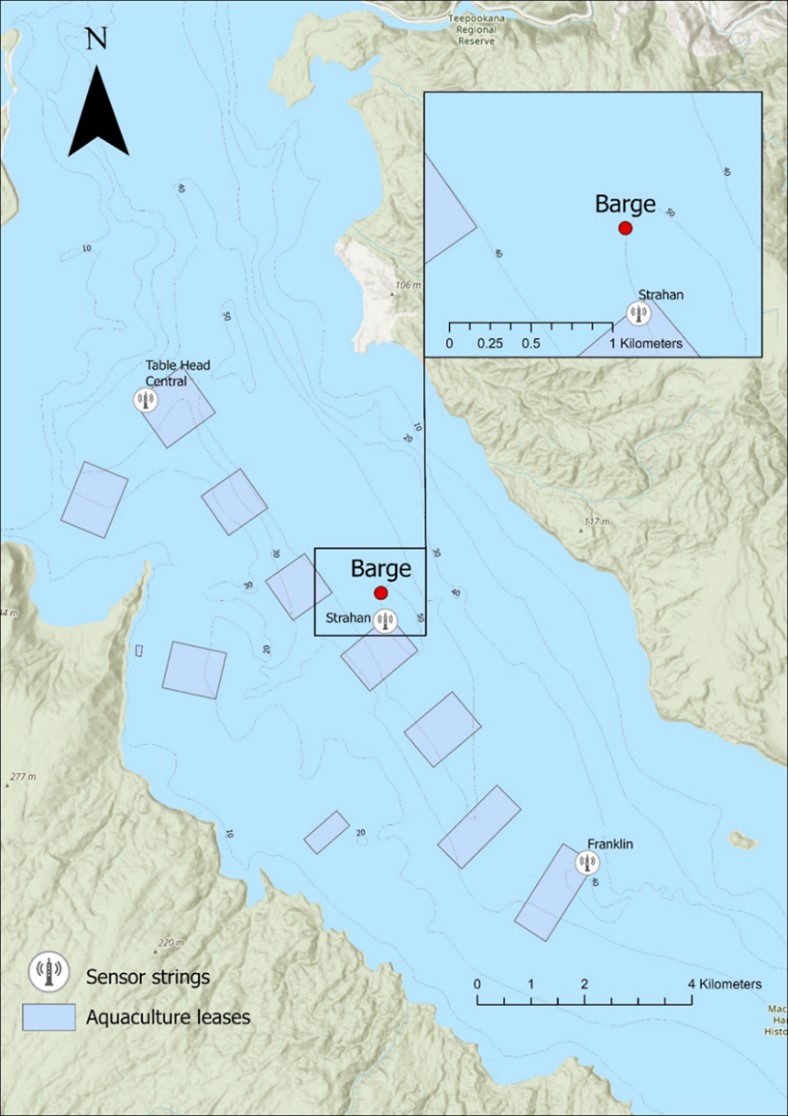
The barge is moored on the edge of a Huon Aquaculture farming lease (North-East of Double Cove marine farming zone) and is approximately 0.7 km to the northeast of the lease boundary (Figure 2).
Figure 1: Pictures of the ‘Wombat’ barge moored in location, the oxygen generator, diesel generator, the pipework and discharge wheel. The static mixer in the pipework on the barge is where the oxygen is injected and dissolved into the seawater that has been drawn from depth. There are additional mixers in the discharge wheel (bottom right) to further break up any remaining microbubbles. The picture on the bottom left is of the installation of the discharge pipe and wheel.
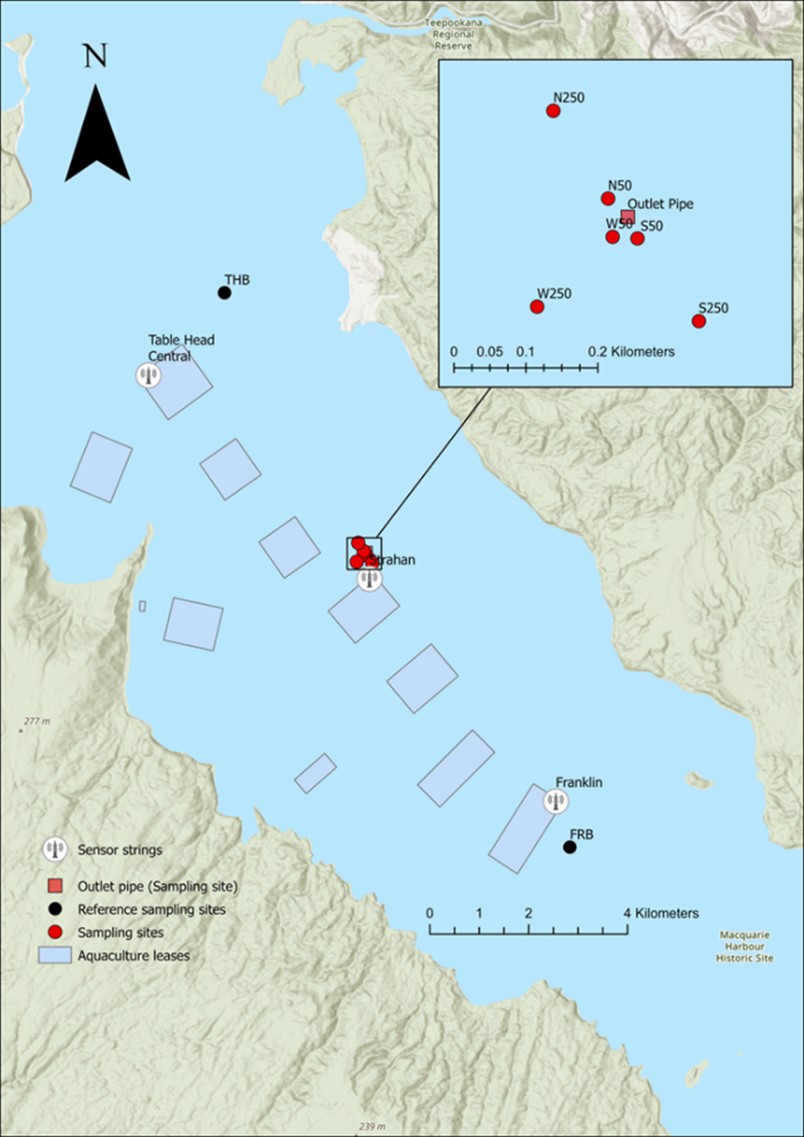
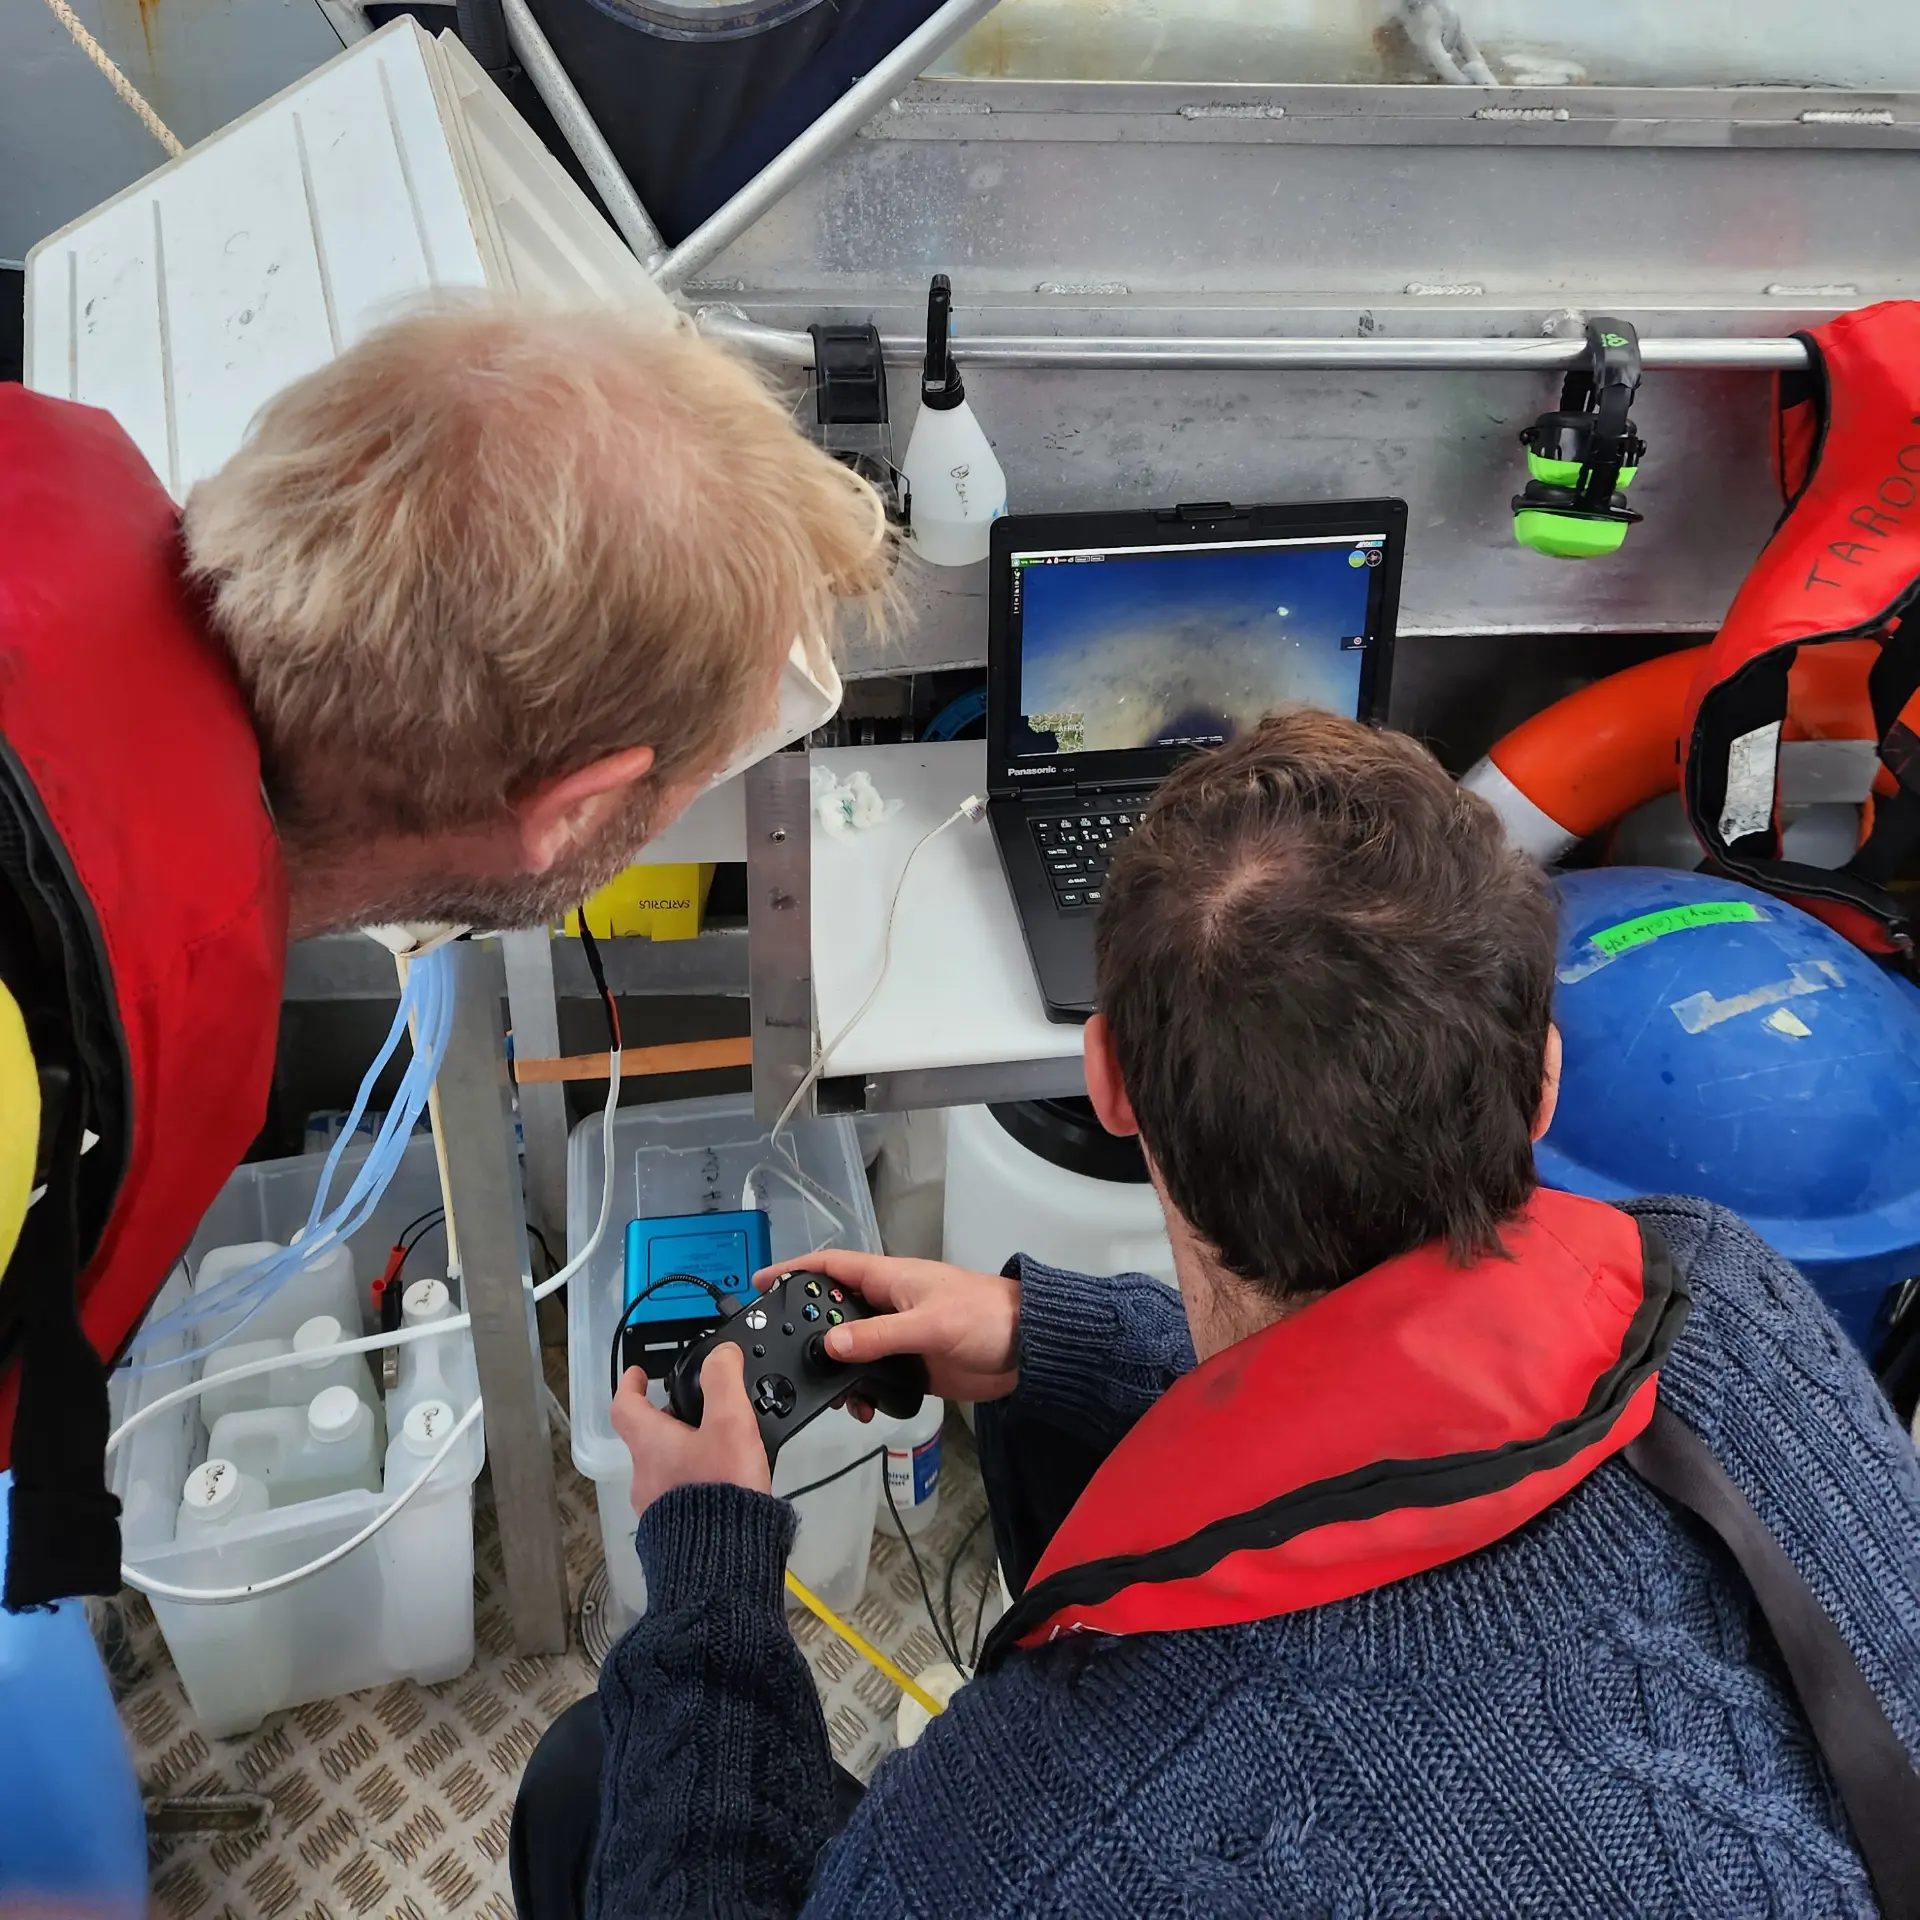
Measuring how effective the oxygenation injection system is at improving oxygen levels in the surrounding water column is achieved through a spatial array of underwater wireless oxygen, salinity and temperature sensors[1] that have been deployed at multiple distances and depths to the northeast and southwest of the injection point[2] (Figure 5). These sensors communicate with a hydrophone and acoustic hub mounted on the barge which then provides the data in real-time via satellite (Starlink) to the Realfish Pro dashboard for viewing via an app. The dashboard is already accessed by researchers, growers and regulators at three environmental monitoring strings situated throughout Macquarie Harbour (Figure 2). This sensor network data is being supplemented with manual profiles of the water column during the trials and other existing and planned deployments of water quality sensors throughout the harbour more broadly. A key purpose of the sensor array near the discharge point will be to ensure that the area of supersaturated water is minimised and consistent with modelling predictions (see below).
Figure 2: Map showing leases in the harbour, the location of the barge (see outlet pipe) and the three environmental strings that have been operational since 2015.
The presence and activity of mobile fauna (e.g. fish) in response to oxygen activity will be monitored and analysed using a combination of fixed and portable cameras.
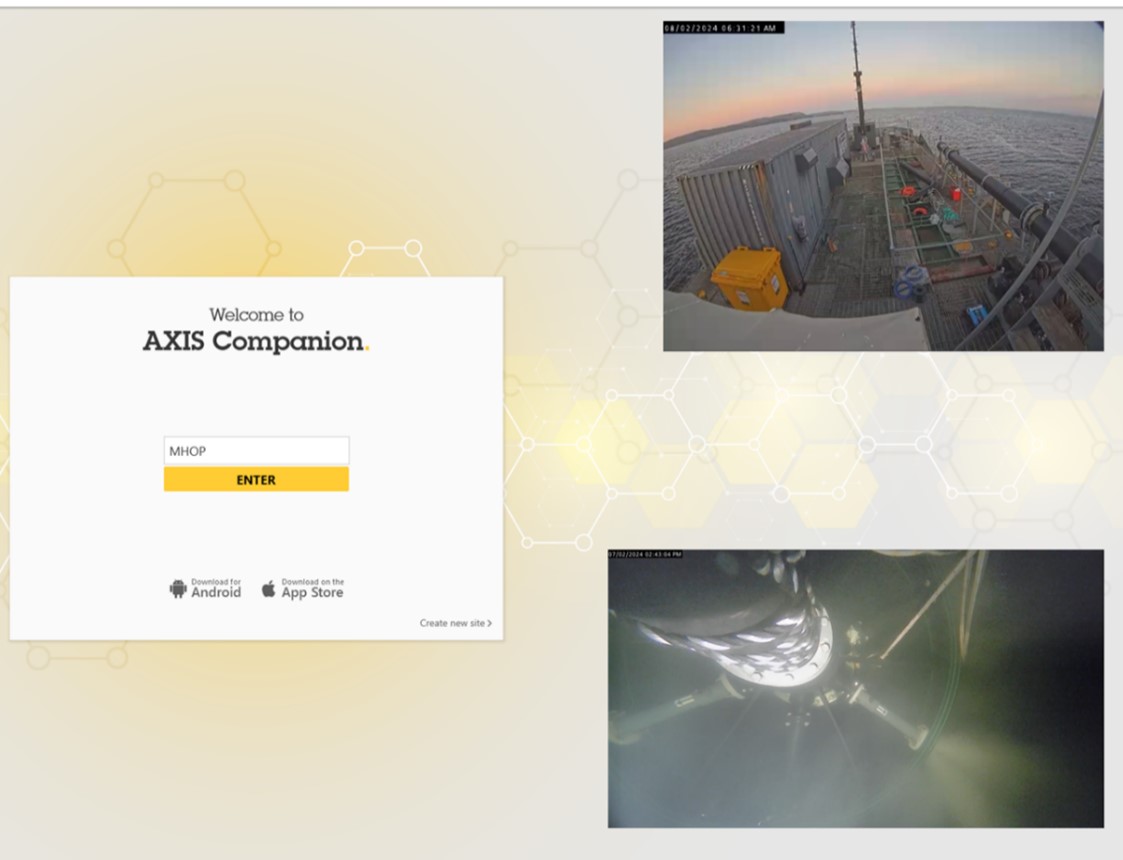
A fixed camera with a live feed is in place on the oxygen system facing the ejection nozzles. This camera provides visual evidence that bubble formation is minimal (formation of excessive bubbles can lead to upwelling, potentially creating issues for animals above the halocline) and monitors any animal interactions with the oxygenated plume. Two additional cameras are deployed on a frame that is located below the discharge wheel, facing upwards and in different directions to ensure multiple points of view. All cameras have lights and video feeds that are viewable in real time on the AXIS dashboard (Figure 4). Remotely operated vehicle (ROV) surveys are conducted before, during and after the oxygenation trials. These provide another source of information for assessing any potential impacts on wildlife or larger fauna. ROV surveys involve dropping a weighted shot line on a predetermined GPS location, deploying the ROV down this line to the seafloor and then travelling for a set duration along a compass bearing. This transect is be repeated at the proposed depth of the oxygenation outlet. This repeatability allows for comparison in time to assess any visible impact of the oxygenation system.
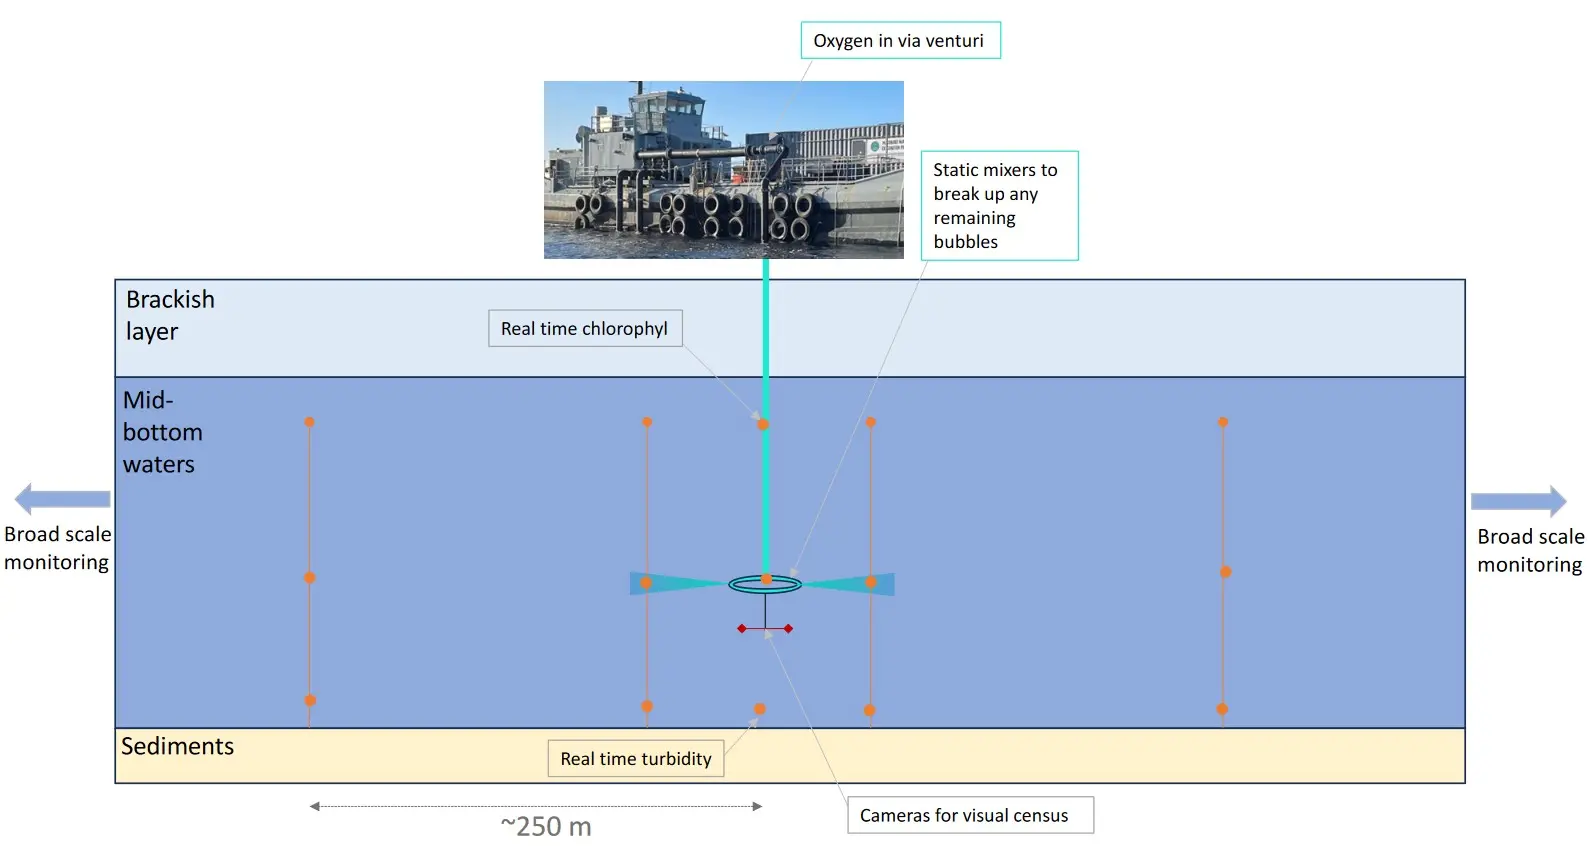
Figure 3: Conceptual diagram showing the location of the real time logger strings relative to the outlet pipe.
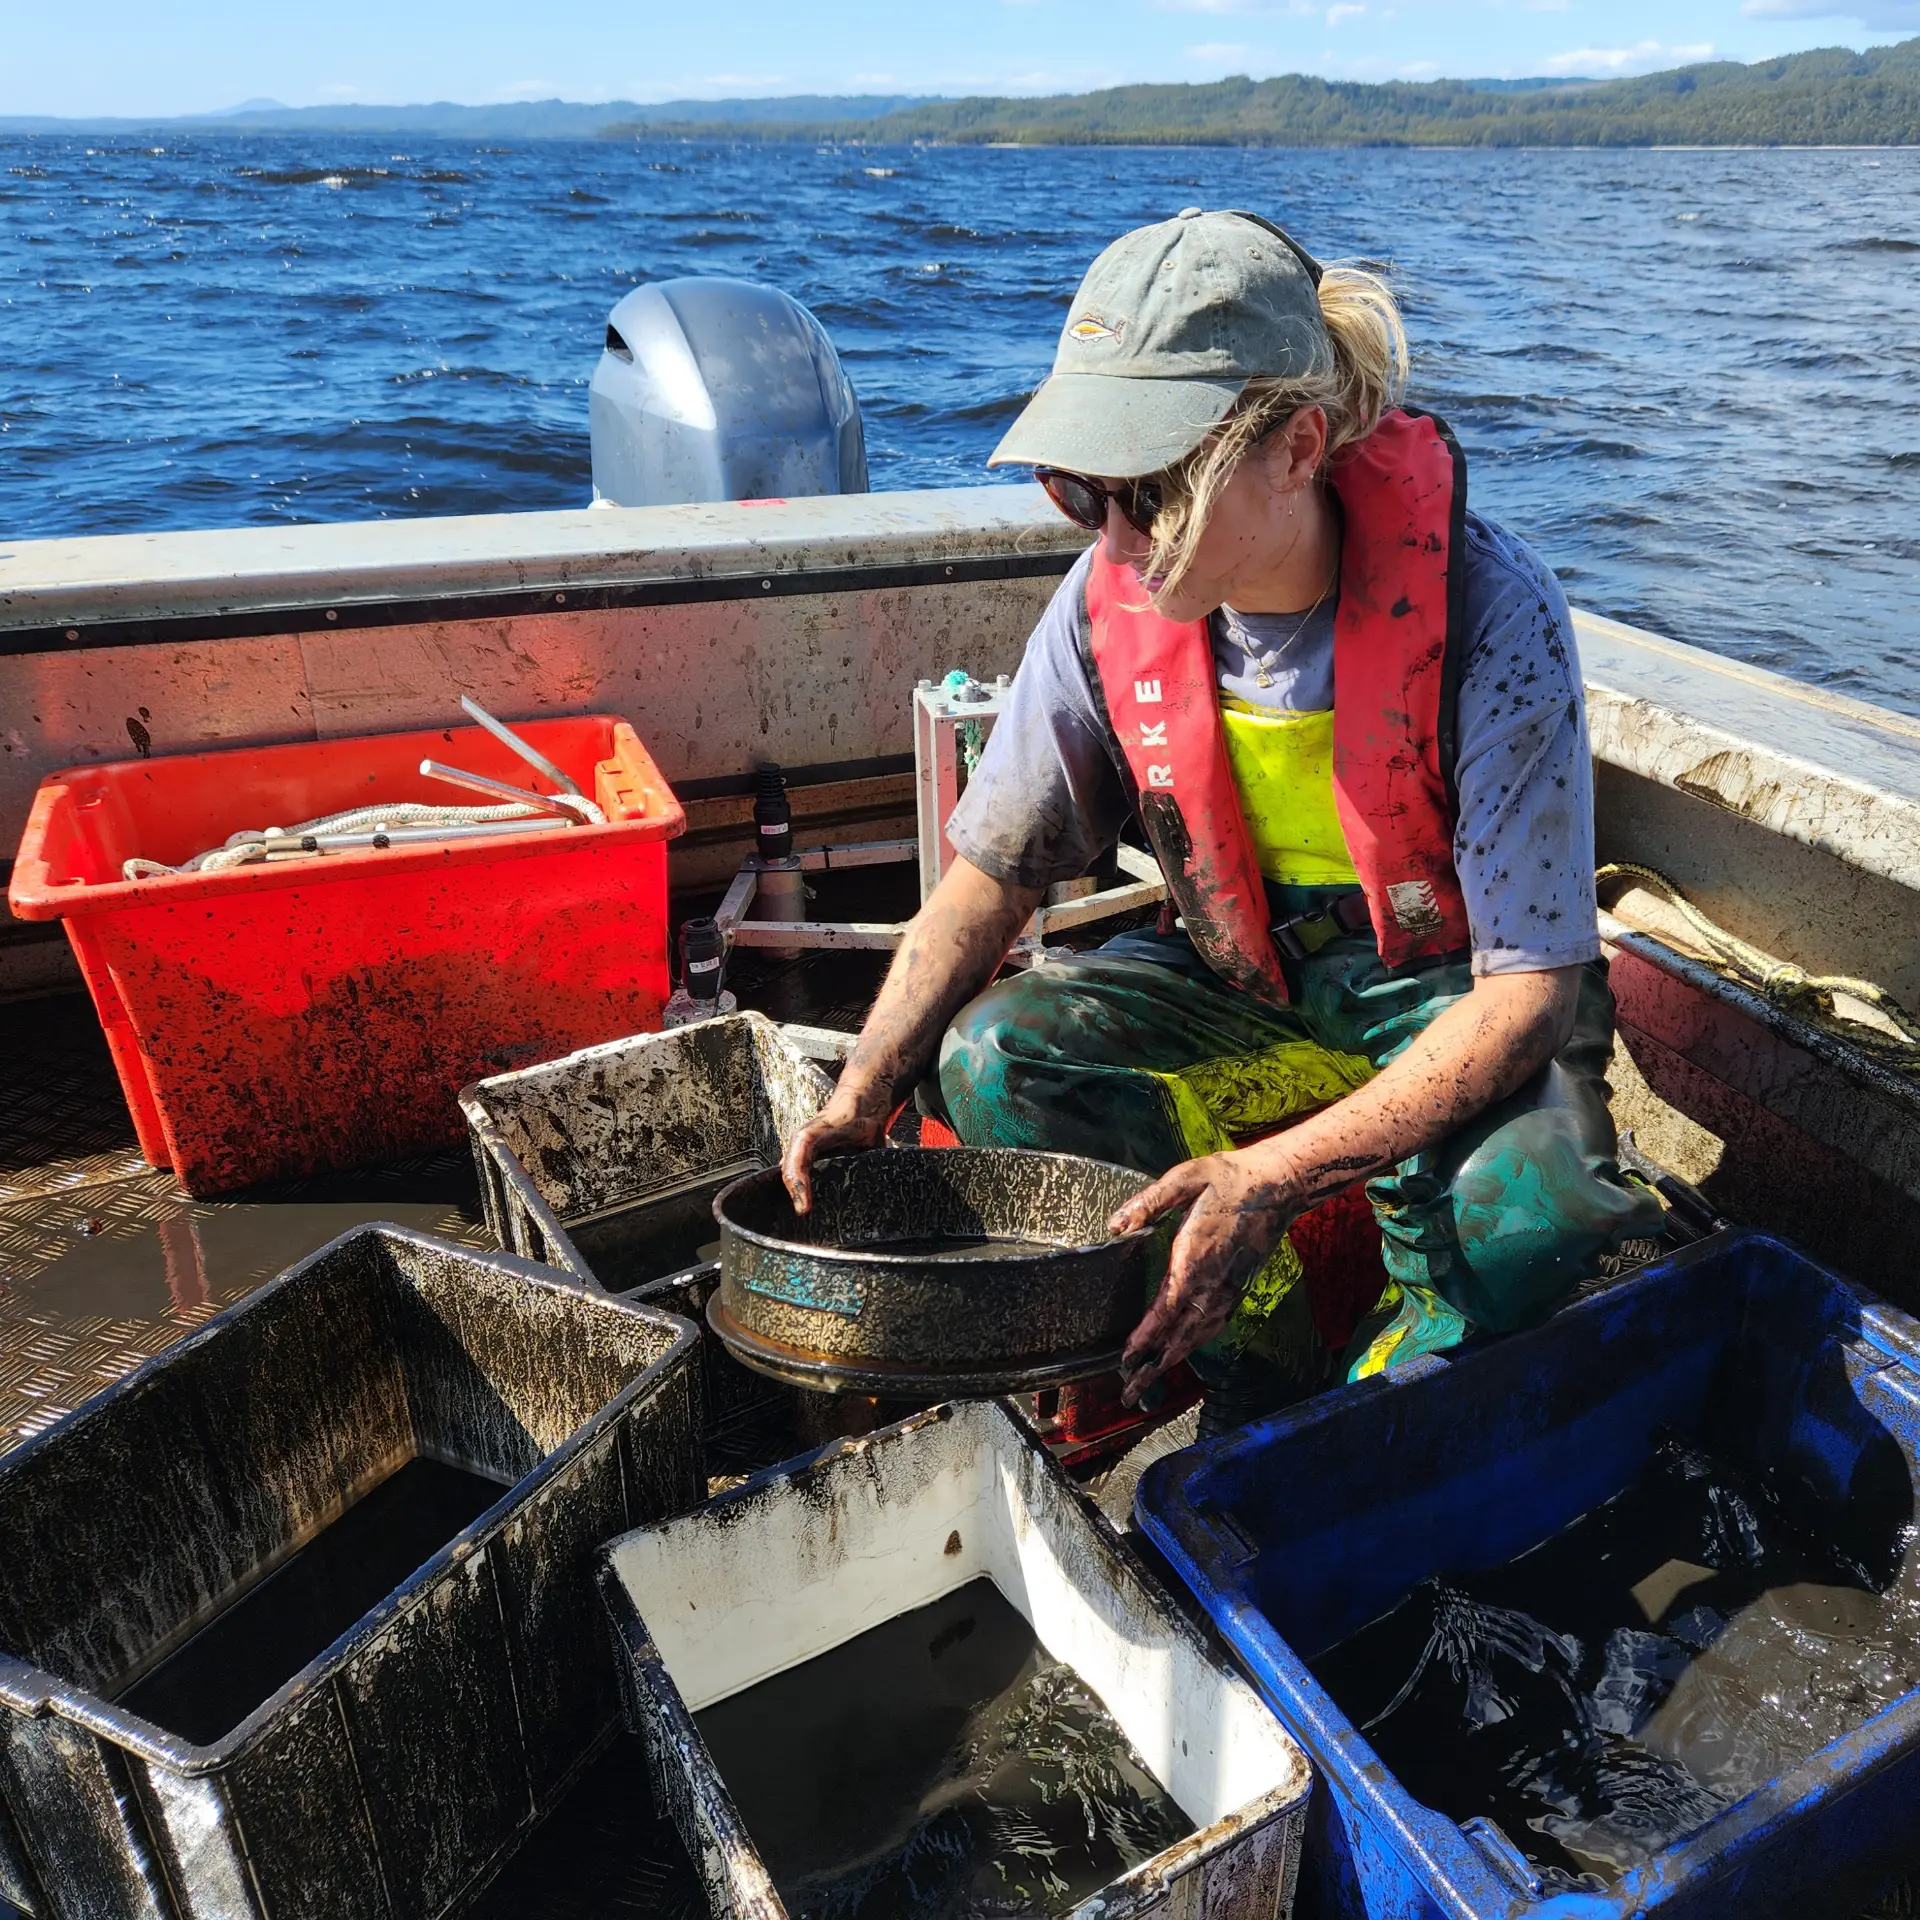
To characterise the response of water column conditions (i.e. beyond oxygen/temperature/salinity) to oxygen injection, samples will be collected before, during and after each trial on 2 to 4 transects radiating out from the point of injection. On each transect, sampling will correspond to the depths and distances where the sensors are deployed (note, the distances and depths sampled will depend on the parameter being measured). Samples will be collected to assess the form and concentration of nutrients (organic carbon, inorganic nitrogen and phosphorus), heavy metals (e.g. dissolved and total copper) and microbial composition and activity.
To characterise the response of sediments in the area of oxygen enrichment, benthic grabs will also be collected at increasing distances on radiating transects. The sediment surveys will occur less frequently than water column measurements, but at minimum, will include a baseline survey before the trials start, 1-2 surveys during the trials, and one survey after the trials. Samples will be collected to evaluate sediment condition (sulphide, redox), nutrient and heavy metal content (carbon and nitrogen) and benthic community structure.
Figure 4: AXIS dashboard for viewing live footage from the deck of the ‘Wombat’ and cameras deployed underwater.
Figure 5: Map showing leases in the harbour, the location of the barge (see outlet pipe) and associated sampling sites. The three environmental strings that have been operational at Table Head Central, Strahan and Franklin since 2015 are also shown.
The modelling component of the project can be separated into two parts that address different scales and questions. Plume modelling will be used to model the near field environment and the dispersion of oxygen from the point of injection. This modelling will be used to run a range of scenarios to inform injection depth, concentration, and the volume and duration of each pumping trial. The model set up will be informed by existing profiles of the water column and Acoustic Doppler Current Profiler (ADCP) measurements collected at the site. At the broader scale, CSIRO’s numerical model that reproduces the main current and mixing patterns in Macquarie Harbour will principally be used to assess the feasibility of scaling the trial and the suitability of multiple injection locations.
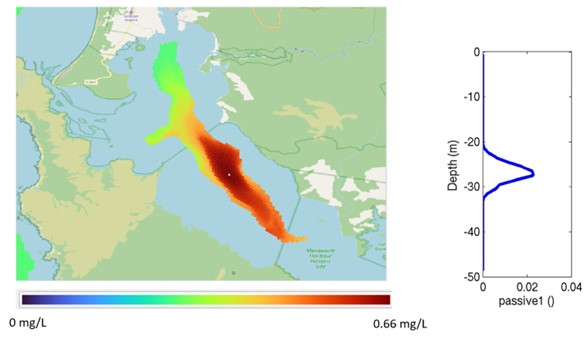
Figure 6: Preliminary model output simulating the release of a passive tracer at the proposed barge location using CSIRO’s numerical model of Macquarie Harbour. The output shows the median concentration of oxygen added after one month and a discharge load of 5000 kg oxygen per day; horizontal (left) and vertical (right).
March 2024
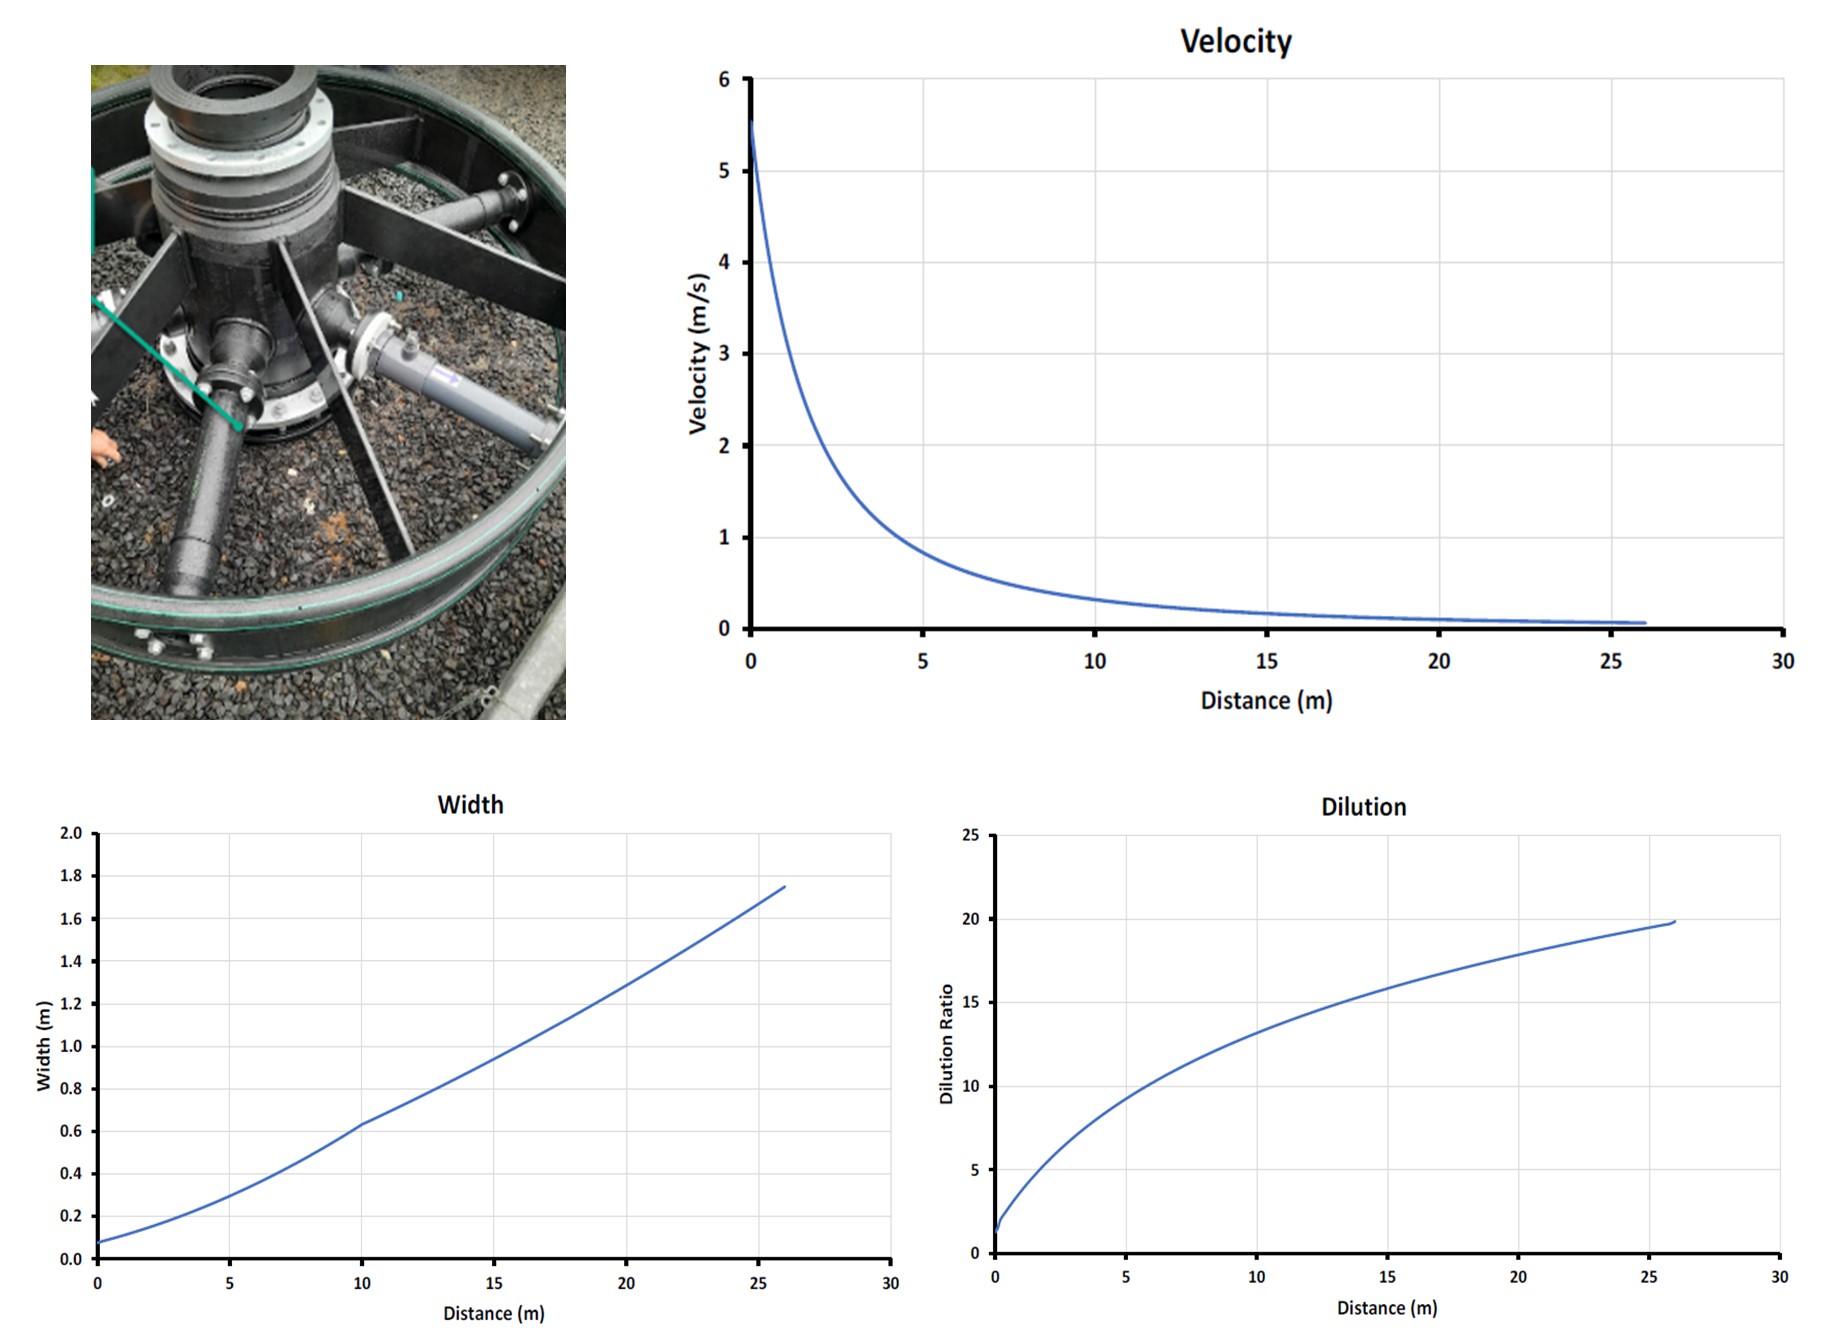
The ‘Wombat’ barge was successfully fitted out and moored in late January 2024. Before the first trial was initiated, plume modelling was completed to inform the injection depth and load. Based on the design of the discharge wheel, the spread and dilution of the jets from each of the six discharge ports was modelled. Each jet starts with a diameter of 0.076 m and an exit velocity of 5.5 m/s. The jets travel horizontally, entraining seawater so they gradually expand, slow down and show increased dilution with distance (Figure 7). At the ambient water current of 4 to 5 cm/s, the jets extend to about 25 m from the rosette before matching the ambient water velocity, in each of the six directions of the ports. Mixing caused by the jets leads to a dilution of 20:1 and a plume width of just over 1.5 m at 25 m from the rosette. As such, the model simulates the spread of oxygenated water over a circle of diameter 50 m and a depth of around 3 - 4 m (centred at the depth of discharge). At a discharge concentration of around 40 mg O2 l-1, the jet dilution will reduce the dissolved oxygen at the end of the spreading jet to around 2 mg O2 l-1. The jet is likely to extend a bit further at times of weak water currents and be diverted and broken up at shorter distance at times of strong currents.
The modelled outputs were further scaled using the CSIRO numerical model of Macquarie Harbour to look at the broader horizontal and vertical dispersion of the predicted plume. The model was used to simulate the release of a passive tracer at the barge location. In Figure 6, the outputs are scaled to show the median concentration of oxygen added after one month and a discharge load of 5000 kg oxygen per day, demonstrating the likelihood for significant horizontal spread and dilution of oxygen throughout the harbour and minimal vertical migration throughout the water column.
Figure 7: The discharge wheel and radial mixers which terminate as a discharge nozzle. Model results for jet velocity (top right), width (bottom left) and dilution (bottom right) with distance from the discharge nozzle.
The model simulations were then used to inform the survey design and location of environmental sensors, with strings deployed at the barge, along with 50 m and 250 m to the north and south (see Figure 3). Sensor strings and the camera system with live feeds (Figure 4) were set up in early February. Baseline sampling of the water column was conducted on 22/12/2023 and 8/2/2024 and baseline sediment sampling was conducted on 15/1/2024, both prior to the first trial (Figure 5).
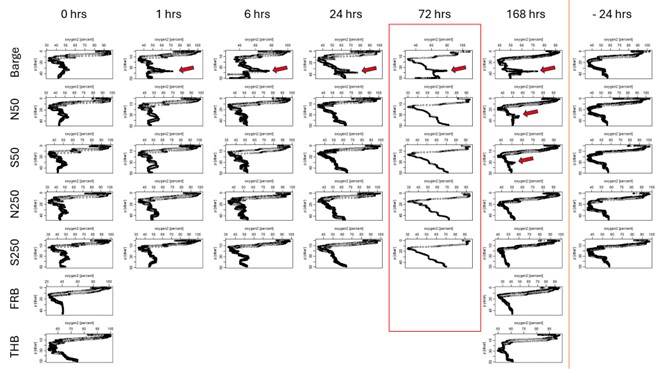
On 20th February 2024, the first trial commenced, injecting ~500 kg O2/day for days 1-3 and 720 kg O2 /day for days 4-7. Extensive water column profiling of dissolved oxygen, salinity and temperature, and grab samples for metals, nutrients and eDNA (plankton community) were collected immediately before, during and after the first trial; see Table 1 and 2 for more detail. From the profiles, the oxygen plume was detectable at 5-10 m from the discharge wheel one hour after the pumping started, and by day 7, the plume was evident at the 50 m sites (Figure 8). There was no evidence of a shift in nutrient concentrations (Figure 9) or metal availability (Figure 10) near, or distant from, the discharge wheel. Whilst there was some evidence of a shift in the plankton community composition in the immediate vicinity (5-10 m) of the discharge wheel, the change was small, not observed further away, and within the natural variability observed in the harbour bottom waters.
Table 1: List of the main water quality sites.
| Sites | Description | ** Notes |
|---|---|---|
| BN | Barge North | |
| BS | Barge South | |
| BW | Barge West | bacteria and 35m only |
| S50 | South 50m | |
| S250 | South 250m | |
| N50 | North 50m | |
| N250 | North 250m | |
| W50 | West 50m | |
| W250 | West 250m | bacteria and 35m only |
| FRB | Franklin River Basin | |
| TRB | Table Head Basin |
Table 2: Details of the parameters, sites and depths sampled during trial #1.
| Time | T0 | T1 | T6 | T24 | T72 | T168 | T192 |
|---|---|---|---|---|---|---|---|
| Sites ** | All | All (excl FRB and TRB) | All (excl FRB and TRB) | All (excl FRB and TRB) | All | All | All |
| Depths (m) | 5, 20, 35, 45 | 35 | 35 | 35 | 35 | 5, 20, 35, 45 | 35 |
| Replicates | 1 | 1 | 1 | 1 | 1 | 1 | 1 |
| Drops per site | 1 | 1 | 1 | 1 | 1 | 1 | 1 |
| Analytes | WQ profile | √ | √ | √ | √ | √ | √ |
| Bacteria eDNA | √ | √ | √ | √ | √ | √ | |
| Nutrients (total and dissolved) | √ | √ | √ | ||||
| NPOC | √ | √ | √ | ||||
| Metals (Dissolved & total) | √ | √ | √ | ||||
| Mercury | √ | √ | √ | ||||
| Site and depth summary | 9 sites @ 4 depths plus 2 (west) sites @ 1 depth | 9 sites @ 1 depth | 9 sites @ 1 depth | 9 sites @ 1 depth | 9 sites @ 1 depth | 9 sites @ 4 depths plus 2 (west) sites @ 1 depth | 9 sites @ 1 depth |
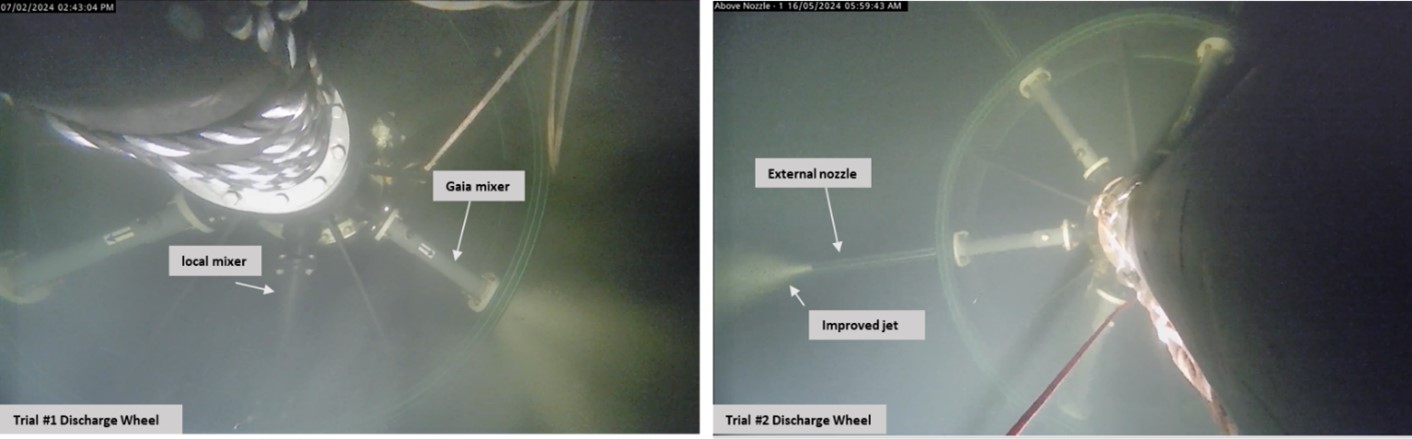
Following a review of the results from the first trial, both the science team and technical advisory committee were of the view that there were no environmental responses that were a cause for concern and that it was therefore appropriate to proceed with the second trial. Scheduled for mid-April, this trial would run for longer (3-4 weeks) and the oxygen load added per day will be increased to 1000 kg and greater. Modifications would also made to the pipework following the first trial. Notably, the mixers on the discharge wheel were replaced with the better performing Gaia mixers (6 in total), the outlet pipe raised from 35 to 30 m depth and external nozzles will be fitted on the diffusers to increase the velocity and spread of the discharge jets.
Figure 8: Oxygen profiles across the water quality sites before, during and after the first oxygenation trial. The red arrows identify the oxygen plume.
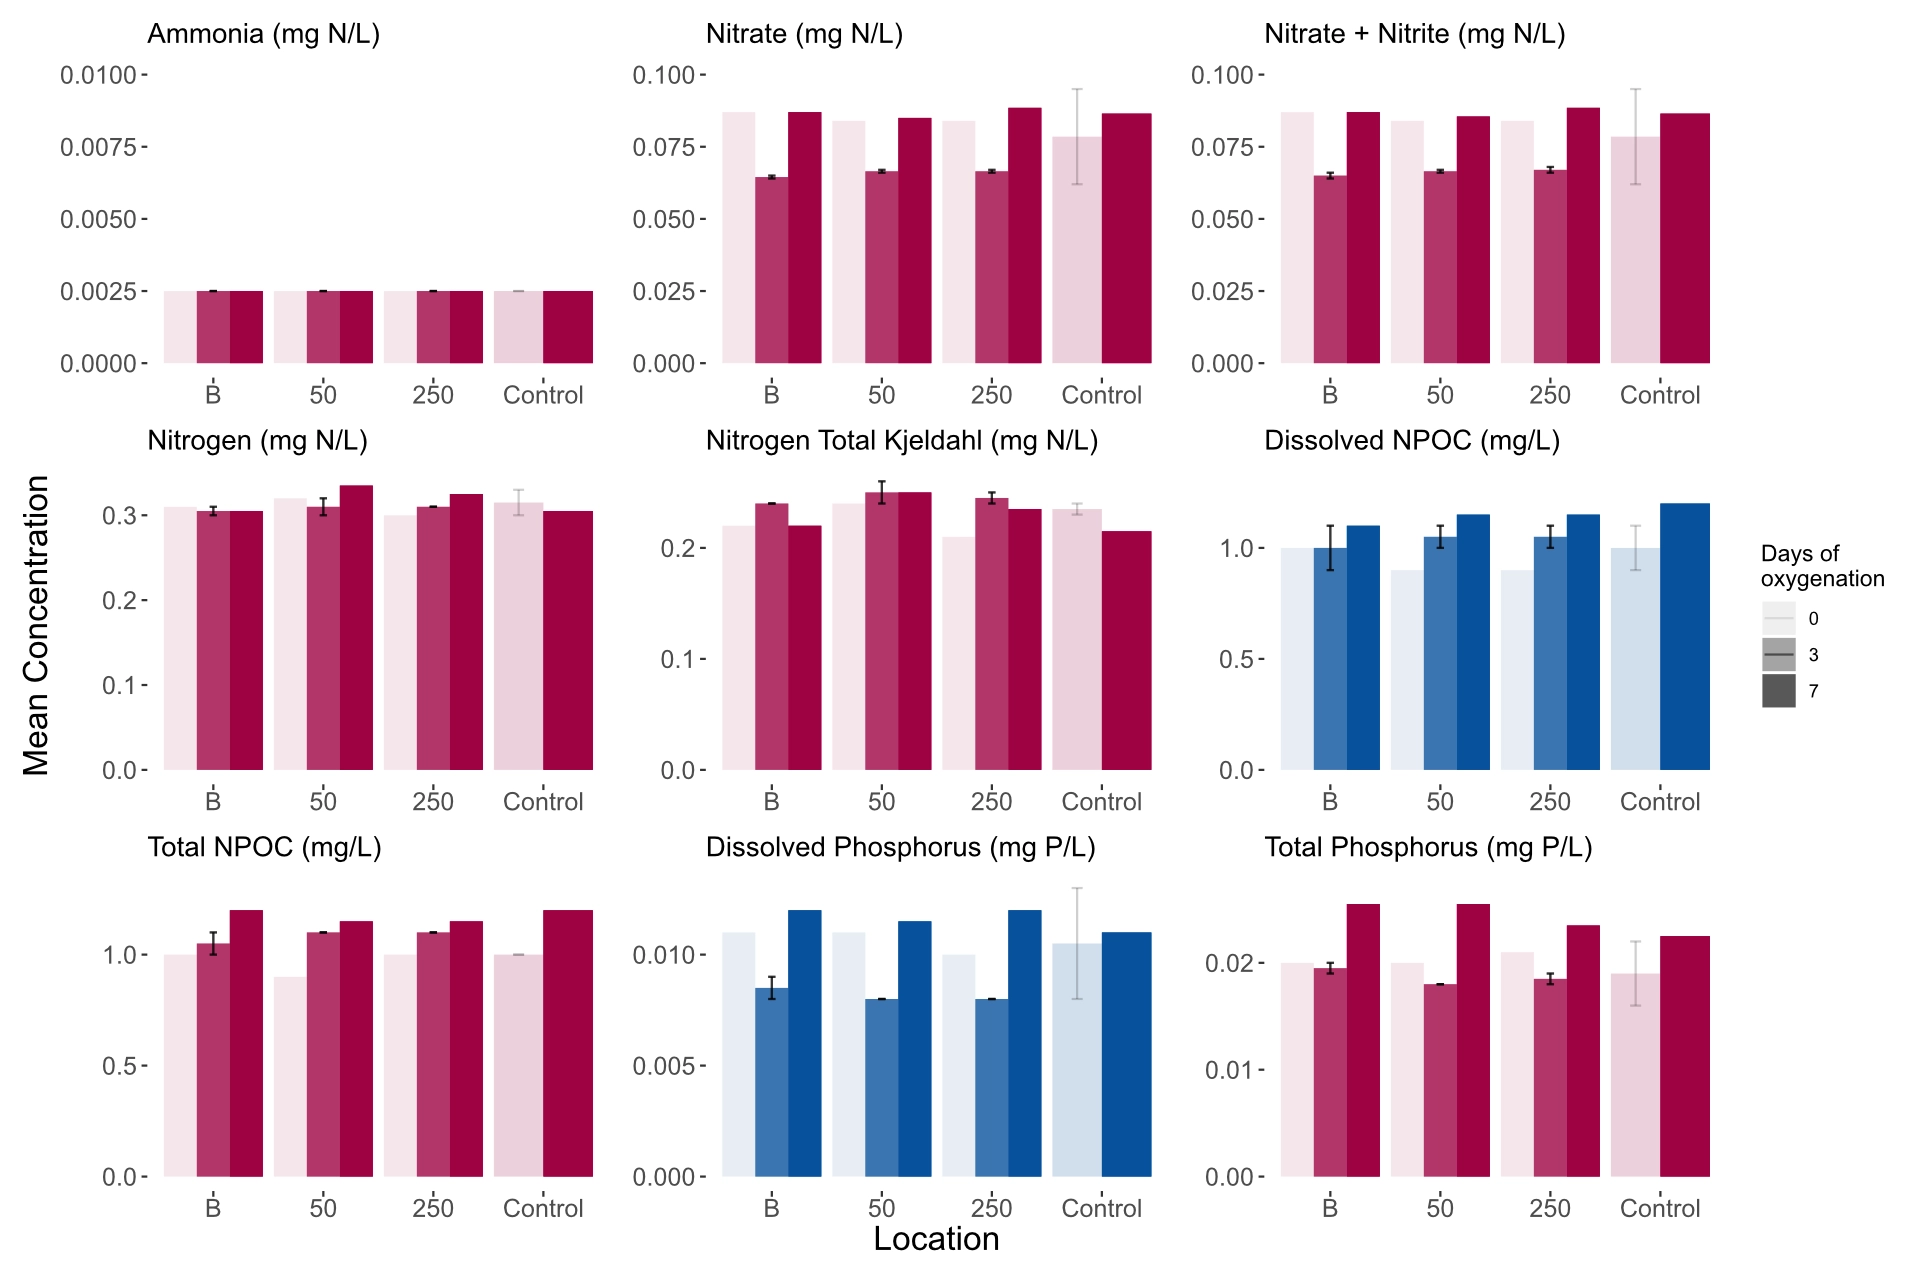
Figure 9: Nutrient concentrations at the water quality sites during the baseline (B1 and B2 on 19 December 2023 and 5 February 2024, respectively), just prior to the start of the first trial (T0), after three days of oxygenation (T72) and after seven days of oxygenation (T168).
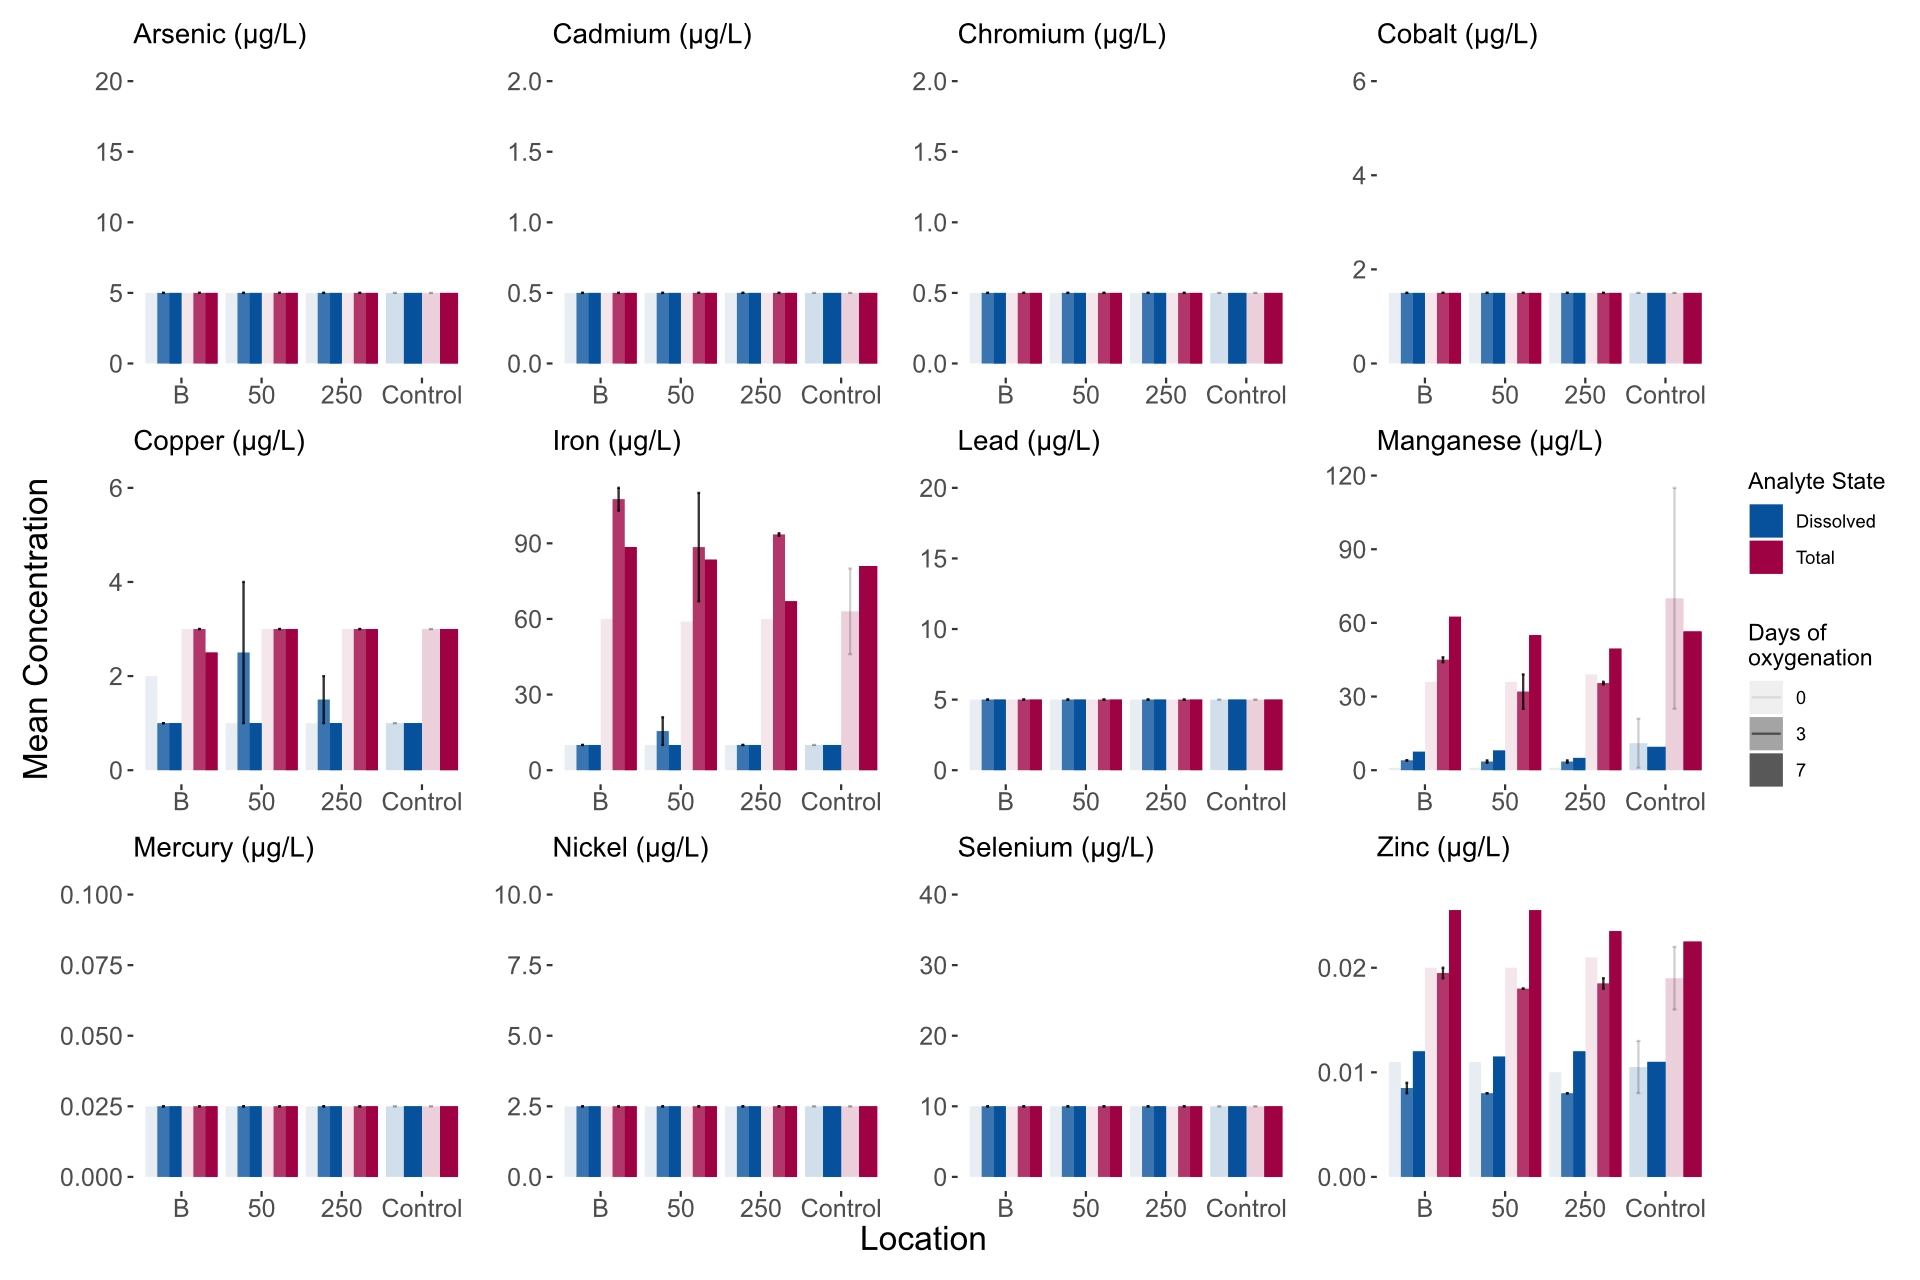
Figure 10: Metal concentrations at the water quality sites during the baseline (B1 and B2 on 19 December 2023 and 5 February 2024, respectively), just prior to the start of the first trial (T0), after three days of oxygenation (T72) and after seven days of oxygenation (T168).
July 2024
For the second trial, modifications were made to the discharge wheel with the better performing Gaia mixers (6 in total) installed on all 6 outlet ports and external nozzles fitted on the end of the mixers to increase the velocity and spread of the discharge jets (Figure 11). The discharge wheel was raised from 35 to 30 m depth to make it more accessible by divers if required. To increase the depth resolution of the in situ real time sensors (i.e. sensor strings) at the depth of the plume at each location, the sensors were redeployed at 2.5 m depth increments between 25 and 35 m depths. For this trial, the strings were deployed at 100 m and 250 m to the north and south of the discharge point, with additional sensors deployed at the discharge point (i.e. 0 m) at 20 m depth and just above the bottom at 45 m depth. At 45 m depth, there is a turbidity sensor to inform us on whether sediments are being disturbed and the sensor at 20 m depth, just below the halocline, monitors any uplift of water and disturbance of the halocline.
Figure 11: Discharge wheel in the first (left) and second trial (right) following modifications to increase the velocity and spread of the discharge jets.
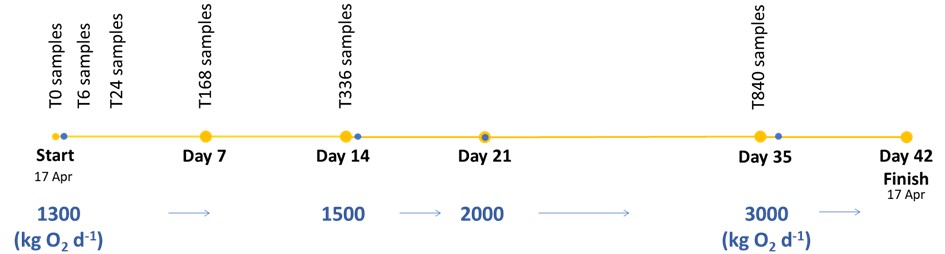
On 17th April 2024, the second trial commenced, with the oxygen load progressively increased based on performance over a six-week period (see timeline in Figure 12). The oxygen load was ~1300 kg O2/day for days 1-14, 1500 kg O2/day for days 14-21, 2000 kg O2/day for days 21-35 and for the last week of the trial, the oxygenation system was again increased, injecting up to ~3000 kg O2 /day. During the trial, the CSIRO model was run in forecast mode, simulating the movement and dilution of the injected oxygen as a passive tracer released from the discharge location and subject to local and regional hydrodynamics (Figure 13).
Figure 12: Timeline for trial #2 with the yellow dots representing when environmental samples were taken and the blue dots representing when oxygen delivery was started and increased.
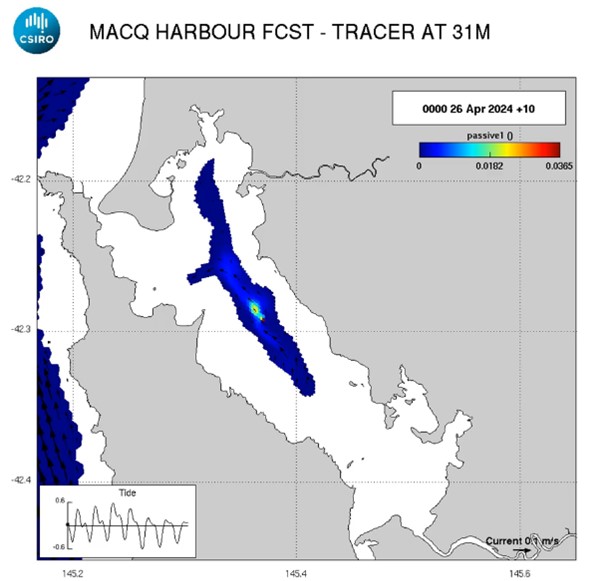
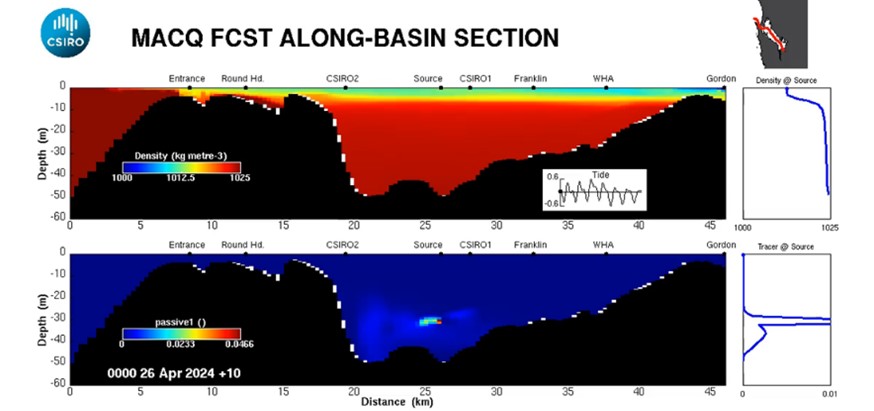
Figure 13: Example model output for trial #2 simulating the release of a passive tracer at the barge location using CSIRO’s numerical model of Macquarie Harbour including the cross-harbour view on the right (see model animations HERE).
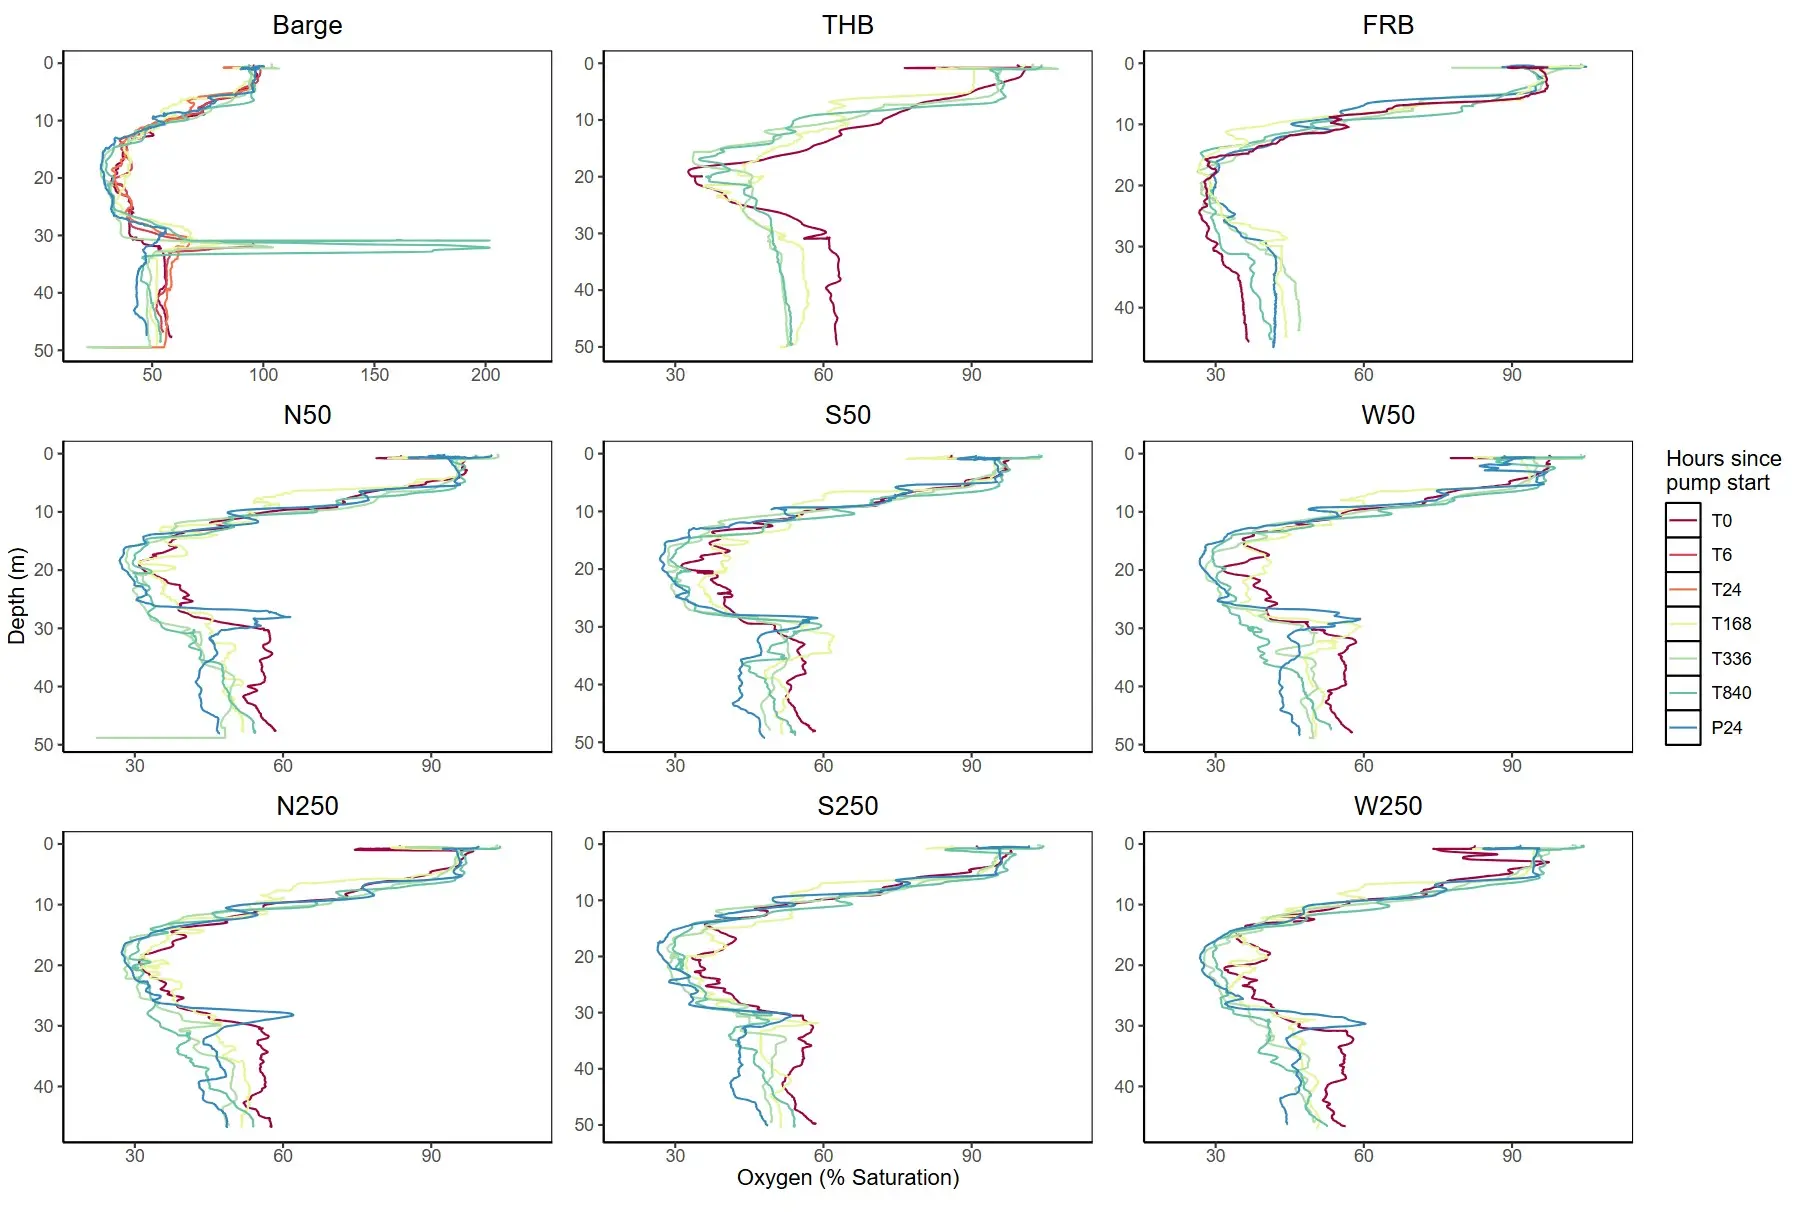
Water column profiling of dissolved oxygen, salinity and temperature, and sediment grab samples for metals, nutrients and eDNA (microbial community) were collected immediately before, during and after the second trial; see Table 3 for more detail. Not surprisingly, when considering the dynamics of the plume and its variation in extent and direction as demonstrated in the model, clear detection in both the profiles and fixed position environmental strings proved challenging. For profiles taken at the water quality and string sites, the plume was clear in the immediate vicinity (5-10 m) of the discharge wheel at the barge (Figure 14).
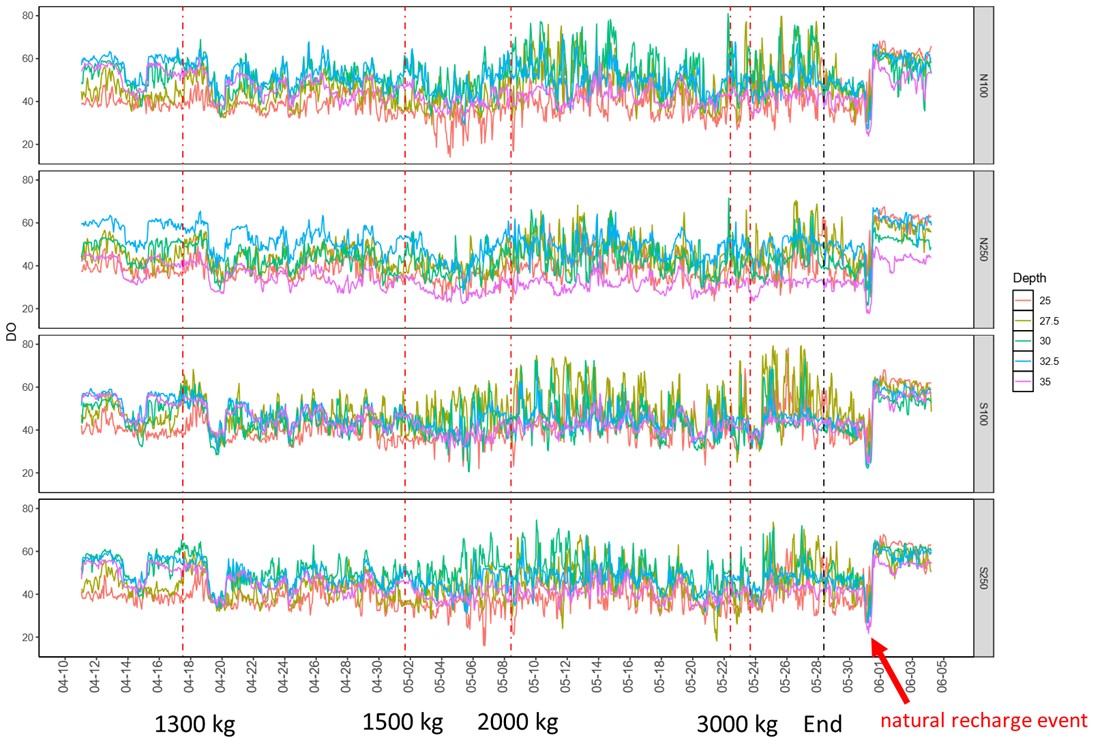
At one and two weeks into the trial, oxygen concentrations just over 100% were detected and at five weeks, concentrations exceeded 200% saturation in the immediate vicinity of the discharge wheel. These concentrations are consistent with expectations based on the oxygen load added and dilution. The detection of the plume at the more distant stations was more variable. At 50 m, the plume was more evident to the south and west at the time of profiling, with increases of 10-15% oxygen saturation typical. Notably, concentrations remained elevated (an increase of 10-20%), in the profiles taken a day after oxygenation ceased, following a rate of ~3000 kg O2/day. At the 250 m stations, there was also evidence of the plume in each direction depending on the date of sampling, with increases of 10-15% saturation observed. At the real time strings 100 m and 250 m to the south and north, it is difficult to see any shift in oxygen concentrations against a highly variable background in the first few weeks of the trial, but after 2-3 weeks when the oxygen load approached ~2000 kg O2/day, there was a noticeable increase in variation and maximum concentrations observed. Concentrations over 70% became regular and this wasn’t seen at comparable depths at the nearby Strahan (~700 m away) or more distant long term string locations.
Table 3: Details of the parameters, sites and depths sampled during trial #2.
| Time | T0 | T6 | T24 | T168 (1 week) | T336 (2 weeks) | T504 (3 weeks) | T840 (5 weeks) | P0 (6 weeks) | |
|---|---|---|---|---|---|---|---|---|---|
| Sites | All | BN, BS, BW | BN, BS, BW | All | All | Oxygen plume | All | All & oxygen plume | |
| Depths (m) | 5, 20, 30, 45 | 30 | 30 | 5, 20, 30, 45 | 5, 20, 30, 45 | Vertical and lateral profiles (~30 m) | 5, 20, 30, 45 | Vertical and lateral profiles (~30 m) | |
| Analytes | Bacterial eDNA | √ | √ | √ | √ | ||||
| Bacterial eRNA | √ (30 m barge only) | √ (30 m barge only) | √ (30 m barge only) | √ (30 m barge only) | √ (30 m barge only) | √ (30 m barge only) | |||
| Water nutrients and metals | √ | √ | √ | √ | |||||
| CTD profile | √ | √ | √ | √ | √ | √ | √ | √ | |
| ROV | √ | √ | √ | √ | |||||
Figure 14: Oxygen profiles across the water quality sites before (T0), at one week (T168), two weeks (T336), five weeks (T840) and one day post-operation (P24) of the second oxygenation trial.
Figure 15: Oxygen concentrations measured in real time at the sensor strings to the north and south of the discharge location before, during and after the trial #2 oxygenation. Notably, three days after the trial finished, there was a recharge and overturning event following a period of very strong NW winds.
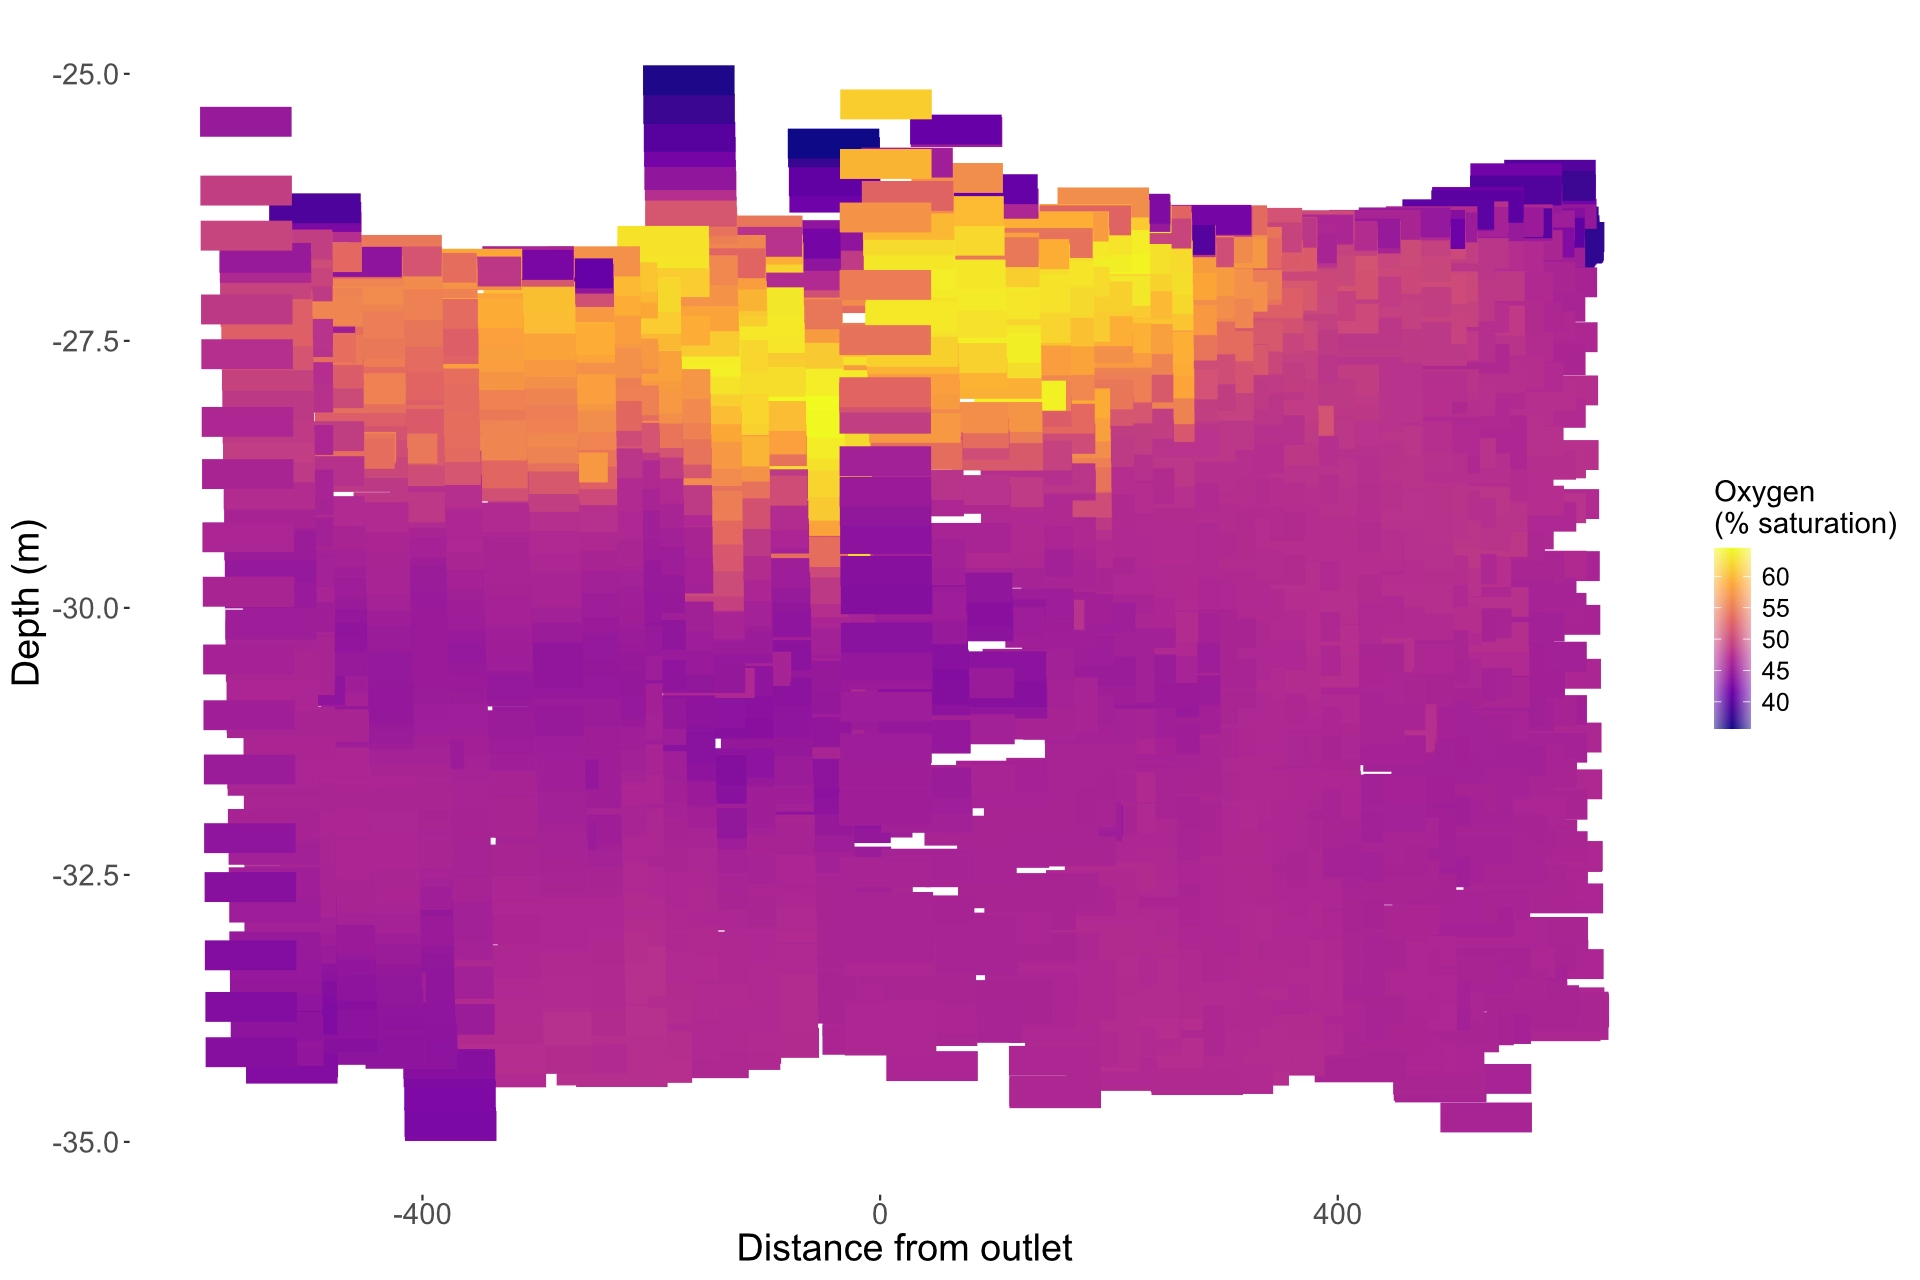
To provide a more detailed picture of the plume, a method was trialled to map the plume one day after the oxygenation finished by profiling up and down through the plume depth whilst gradually moving along a transect from the outlet. The picture this produced indicated a plume of elevated (increases in saturation of 5-10%) oxygen approximately 800 m long and 5-10 m thick. This method will be developed further and mapping the plume in greater resolution will be a major focus of the next trial.
Particularly noteworthy is the natural recharge event captured on the string sensors four days after the oxygenation ceased. This reflected a period of stormy weather and strong NW winds down the harbour which drove intense vertical mixing of the water column. Oxygen levels measured on our sensors first declined before increasing and stabilising. This reflects the lower oxygen water that resides immediately above (~15-20 m depth) the sensor depths (25-35 m), first mixing downwards then being followed by the shallower, more oxygenated waters.
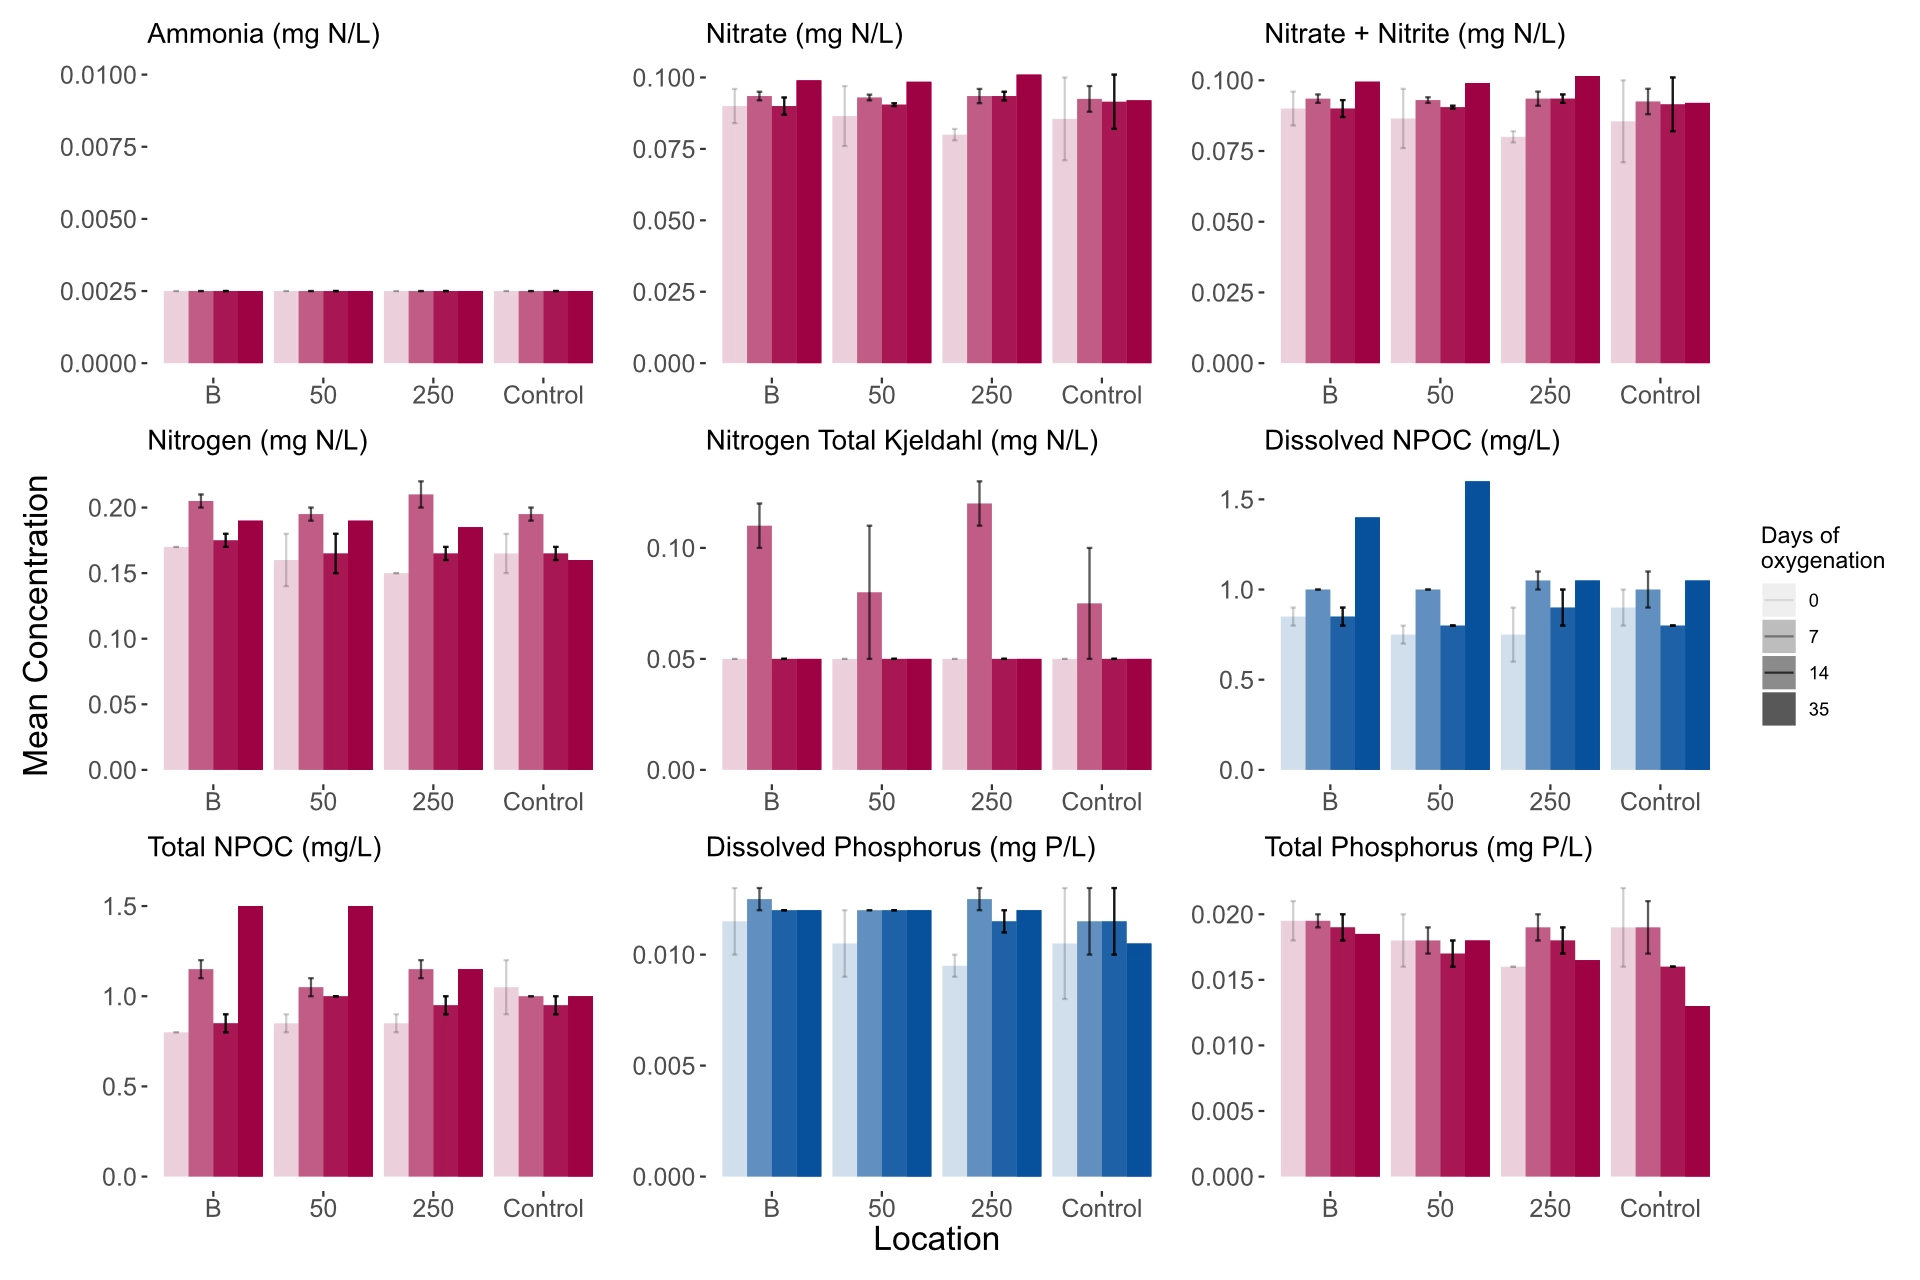
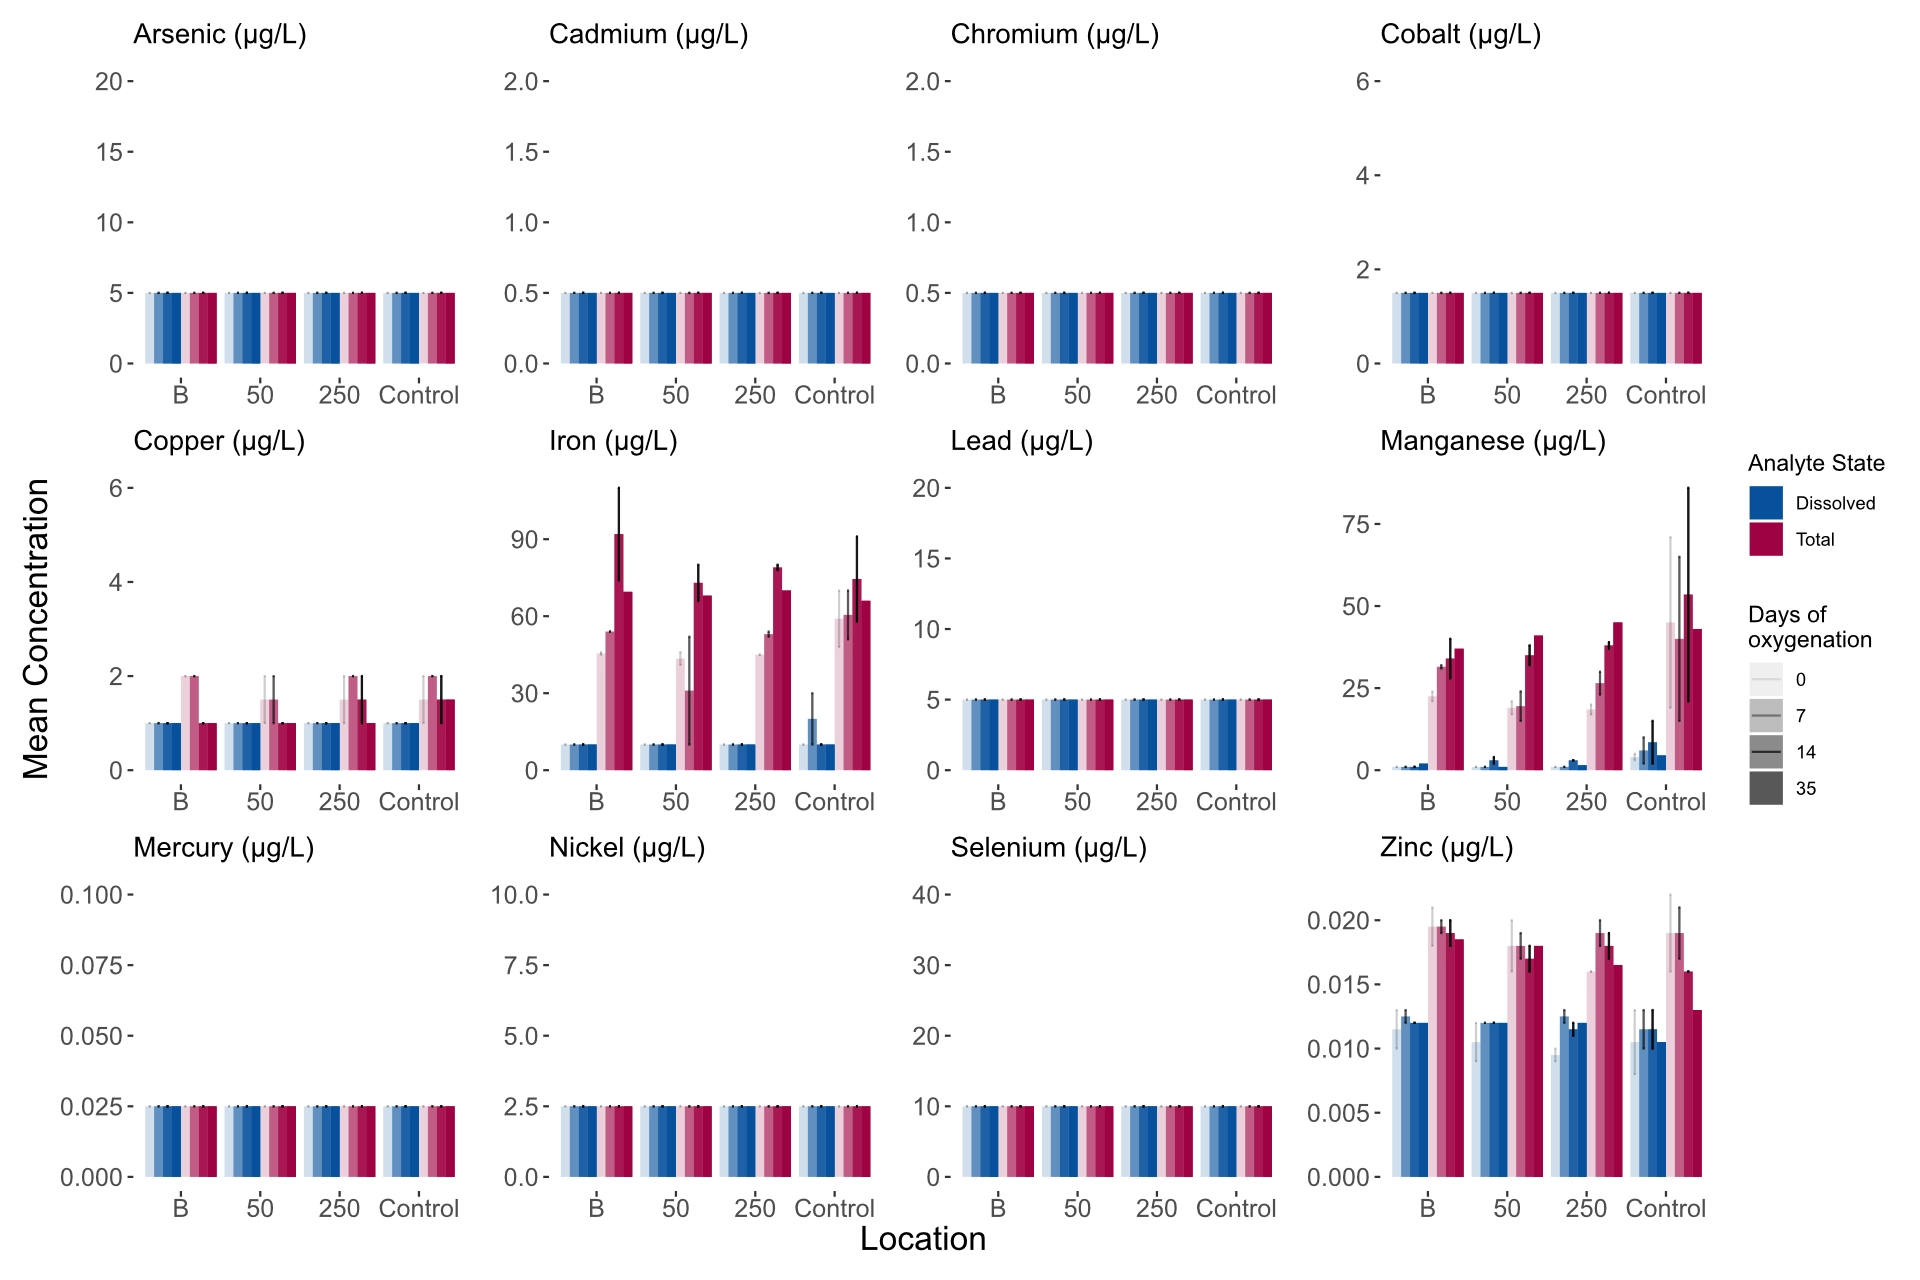
Consistent with trial #1, there was no evidence of a shift in nutrient concentrations (Figure 9) or metal availability (Figure 10) near, or distant from, the discharge wheel. For some parameters, concentrations changed throughout the trial, but there were no patterns with proximity to the discharge wheel. For plankton community composition, there was clear evidence of a shift in time, but this was observed across the harbour with no evidence of a change in composition with proximity to the discharge wheel (Figure 19). These results suggest that the shift in plankton community is caused by natural variation in the harbour ecosystem (i.e. a seasonal change).
Figure 16: Oxygen concentration at depth and distance from the outlet based on profile mapping of the plume one day after the pumping was stopped.
A third trial is expected to commence mid-August with oxygen loads to be progressively increased beyond 3000 kg O2/day. It is likely the maximum load capacity for the discharge wheel is being approached, beyond which it is expected that oxygen will come out of solution and form larger bubbles, at which stage the installation of a second discharge wheel will be required. The aim will be to approach the maximum capacity of the oxygen generator (~5000 kg O2/day) by utilising two discharge wheels. The environmental monitoring for this trial will be more focused on profiling and mapping of the oxygen plume. This may also include the use of the inert fluorescent dye rhodamine as a tracer of the injected water and oxygen. As the oxygenation load has increased during each phase, there has been a five-fold decrease in the energy requirements for every kilogram of oxygen delivered; achieving more gains remains a key focus for the engineering team.
Figure 17: Nutrient concentrations at the water quality sites before the trial (0 days) and at seven days, 14 days and 35 days into the second oxygenation trial.
Figure 18: Total metal concentrations at the water quality sites before the trial (0 days) and at seven days, 14 days and 35 days into the second oxygenation trial.
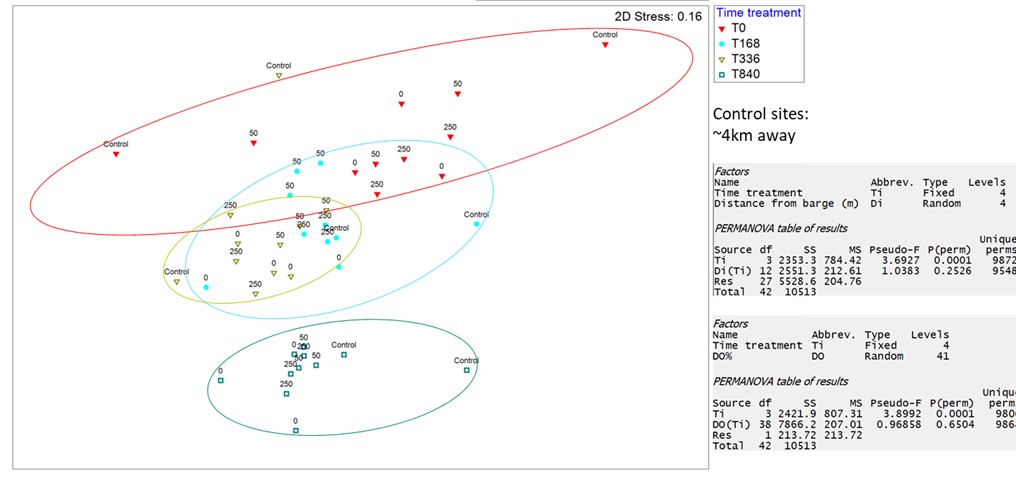
Figure 19: nMDS plot showing the bacterial community shift during Trial #2. 0, 50 and 250 refer to distances of observations (m) from the oxygenation site. Control sites are approximately 4 km away. T0, T168, T336 and T840 denote the time since the start of oxygenation in hours. Note, the 0 m samples don’t show a different or enhanced shift compared to the other sites, indicating that the oxygenation has no significant effect on the community. Similarly, PERMANOVA analysis showed no significant effect of oxygenation on the community structure, using either measured dissolved oxygen (DO) or distance from oxygenation site as proxies for oxygenation.
[1] see innovasea.com for a description of the sensors and platform.
[2] the distances and depths will vary between trials, but typically span 0 - 250 m from the discharge point in each direction and across depths from 20 - 40 m.
FRDC: FRDC is a co-funded partnership between the Australian Government and fishing and aquaculture industries. As a statutory corporation, FRDC plans, invests in and manages R&D for fishing, aquaculture and the wider community and encourages adoption of the resulting knowledge and innovation for impact.
IMAS: The Institute for Marine and Antarctic Studies (IMAS) is an internationally recognised centre of excellence at the University of Tasmania whose mission is to improve understanding of temperate marine, Southern Ocean and Antarctic environments, their resources, and their roles in the global climate system through research, education and outreach.
Image Credit: All images used in this report are provided courtesy of IMAS.
Disclaimer: The authors do not warrant that the information in this document is free from errors or omissions. The authors do not accept any form of liability, be it contractual, tortious, or otherwise, for the contents of this document or for any consequences arising from its use or any reliance placed upon it. The information, opinions and advice contained in this document may not relate, or be relevant, to a reader’s particular circumstance. Opinions expressed by the authors are the individual opinions expressed by those persons and are not necessarily those of the Institute for Marine and Antarctic Studies (IMAS) or the FRDC.
Bell J, Lyle J, Semmens J, Awruch C, Moreno D, Currie S, Morash A, Ross J, Barrett N (2016) Movement, habitat utilisation and population status of the endangered Maugean skate and implications for fishing and aquaculture operations in Macquarie Harbour. FRDC 2013/008. Institute for Marine and Antarctic Studies, Hobart, Tasmania
DCCEEW (2023) Conservation Advice for Zearaja maugeana (Maugean skate). Department of Climate Change, Energy, the Environment and Water, Canberra
Larsen SJ, Kilminster KL, Mantovanelli A, Goss ZJ, Evans GC, Bryant LD, McGinnis DF (2019) Artificially oxygenating the Swan River estuary increases dissolved oxygen concentrations in the water and at the sediment interface. Ecological Engineering 128:112-121
Liu S, Zhao L, Xiao C, Fan W, Cai Y, Pan Y, Chen Y (2020) Review of artificial downwelling for mitigating hypoxia in coastal waters. Water 12:2846
MHDOWG (Macquarie Harbour Dissolved Oxygen Working Group): Final Report to the Tasmanian Salmonid Growers Association, 2014.
Moreno D, Lyle J, Semmens J, Morash A, Stehfest K, McAllister J, Bowen B, Barrett N (2020) Vulnerability of the endangered Maugean Skate population to degraded environmental conditions in Macquarie Harbour. FRDC 2016/068. Institute for Marine and Antarctic Studies, University of Tasmania, Hobart, Tasmania
Moreno D, Semmens J (2023) Interim report - Macquarie Harbour Maugean skate population status and monitoring. Institute for Marine and Antarctic Studies, University of Tasmania, Hobart, Tasmania
NRE Tas (2024) Conservation Action Plan for the Maugean Skate. Department of Natural Resources and Environment Tasmania, Hobart, Tasmania
Ross J, MacLeod C (2017) Understanding oxygen dynamics and the importance for benthic recovery in Macquarie Harbour - Progress Report May 2017. FRDC 2016/067: Environmental Research in Macquarie Harbour. Institute for Marine and Antarctic Studies, Hobart, Tasmania
Ross J, Wild-Allen K, Macleod C (2017) Understanding oxygen dynamics and the importance for benthic recovery in Macquarie Harbour - Progress Report September 2017. FRDC 2016/067: Environmental Research in Macquarie Harbour. Institute for Marine and Antarctic Studies, Hobart, Tasmania
Ross J, Beard J, Wild-Allen K, Andrewartha J, Stehfest K, Durand A, Semmens J, Davey A, Hortle J, Pender A, Quigley B, Macleod C, Moreno D (2021) Understanding oxygen dynamics and the importance for benthic recovery in Macquarie Harbour. FRDC 2016/067: Environmental Research in Macquarie Harbour. Institute for Marine and Antarctic Studies, Hobart, Tasmania
Stigebrandt A, Andersson A (2022) Improving oxygen conditions in periodically stagnant basins using sea-based measures-Illustrated by hypothetical applications to the By Fjord, Sweden. Continental Shelf Research 244:104806
U.S. Army Corps of Engineers (2021) Startup Run Data Collection and Modeling Report for the Oxygen Injection System Environmental Testing for the Savannah Harbor Expansion Project.
Wild-Allen K, Andrewartha J, Baird M, Bodrossy L, Brewer E, Eriksen R, Skerratt J, Revill A, Sherrin K, Wild D (2020) Macquarie Harbour Oxygen Process model (FRDC 2016-067): CSIRO Final Report. In: FRDC. (ed). CSIRO Oceans & Atmosphere, Hobart, Australia
[1] see innovasea.com for a description of the sensors and platform
[2] the distances and depths will vary between trials, but typically span 0 - 250m from the discharge point in each direction and across depths from 20 - 40m.
You can get your own offline copy of the Macquarie Harbour Oxygen Project - Enhancing Oxygen Levels at Depth here.